

Photo Credit: Sean Pavone / Shutterstock
As the pandemic’s effects on the economy continue to play out, one major concern on the minds of economic observers is inflation. Aggressive government stimulus over the last two years, supply chain breakdowns, and continued uncertainty around the spread of COVID-19 and its effects on certain industries are all potentially contributing to rising prices in the economy.
One positive development along these lines has been wage growth. Job growth has slowed down in recent months, and labor force participation rates are still significantly below pre-pandemic levels. Because the labor supply is limited, employers are raising wages to entice workers to take jobs, which has led to some of the sharpest wage increases in years.
But a more concerning trend has taken hold in the cost of housing. The market for residential real estate purchases has been highly competitive during the pandemic, with an influx of new buyers boosted by low interest rates and strong savings and investment returns. However, the market has seen relatively low supply, with fewer existing homes coming up for sale and new construction failing to keep up due to labor and supply shortages. The supply constraints have driven up housing prices—often a leading indicator for rents—and renters are now feeling the effects.
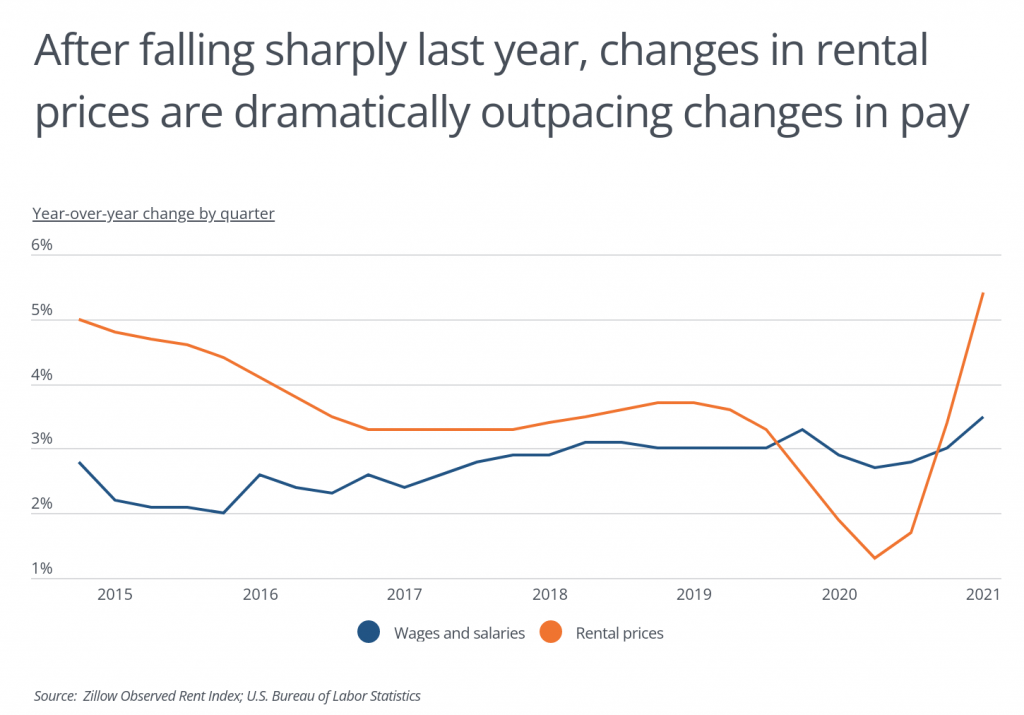
The result of these conditions has been a fairly gradual increase in the rate of wage growth accompanied by a much sharper increase in rental prices. The rate of rental price growth dipped at the start of the pandemic, falling from 3.3% year-over-year at the end of 2019 to a low of 1.3% in September 2020, and has since rebounded sharply to 5.4% in June of this year. In contrast, wage growth was around 3% before the pandemic, held fairly steady between 2.5% and 3% throughout 2020, and recently ticked up to 3.5%.
While the upward trend in wage growth is good news for laborers, the even faster rise in the cost of housing could more than wipe out the real value of those gains. Housing affordability is already a major issue for low and middle income populations because it is most households’ greatest expense. If rents are rising faster than wages, there is a risk that more people will be housing burdened in the future, which in turn makes it harder to afford other household spending categories.
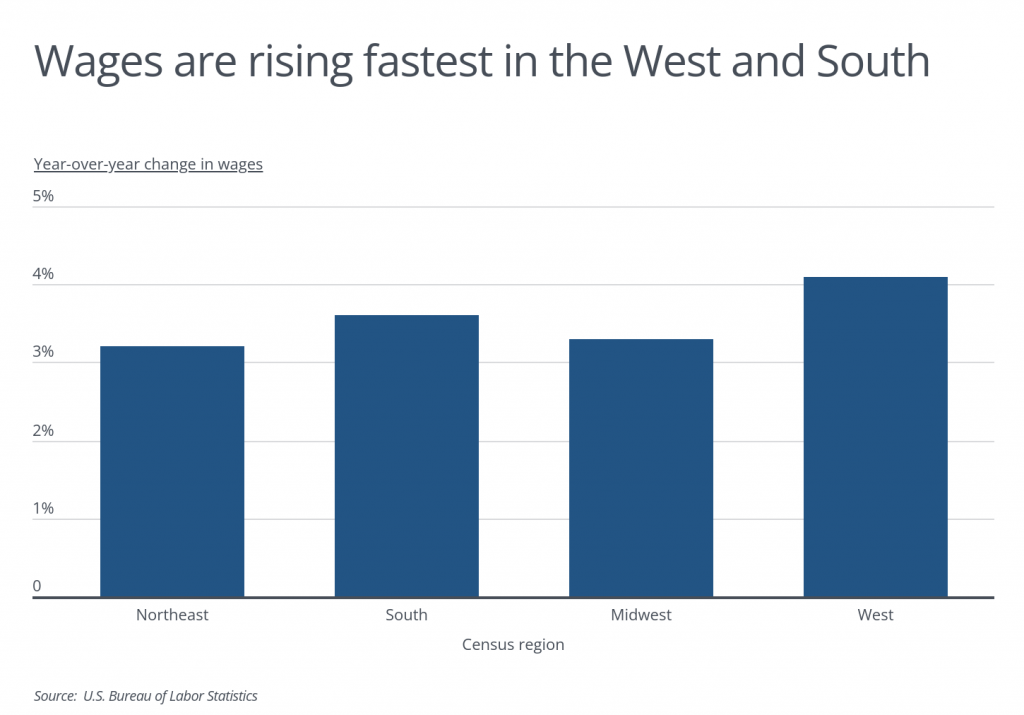
But both housing costs and wages are highly dependent on local conditions in the economy, and certain regions have felt the effects of these trends more strongly than others. On the wage front, the Western U.S. has seen the greatest increase at 4.1%, outpacing the rate of growth for the three other major Census regions. Residents of states and localities in the West may have an easier time keeping up with rising prices for household spending categories.
When it comes to rents, it is the areas that have been most expensive in recent years, like the Bay Area, New York, and Boston, that have seen slower growth in rent prices than other cities. This is likely in part because many workers left these cities in search of more space or lower costs during the pandemic, which has helped keep demand in check. Cities that have more recently had lower housing costs, in contrast, have seen dramatic spikes in rental costs with an influx of new residents competing for space. In these areas, the disparities between wage growth and rental price increases are most substantial.
The data used in this analysis is from the U.S. Bureau of Labor Statistics’ Employment Cost Trends survey and Zillow’s Zillow Observed Rent Index. To identify the metropolitan areas where wages are growing faster than rents, researchers at Stessa calculated the percentage point difference between the year-over-year change in wages and the year-over-year change in rent for the period ending Q2 2021. In the event of a tie, the metro with the larger increase in wages was ranked higher. Only the 15 major U.S. metropolitan areas covered in the BLS survey were included in the analysis.
Here are the metros where wages are growing faster than rents.
The Difference Between Wage & Rent Growth in America’s Major Metros

Photo Credit: Sean Pavone / Shutterstock
15. Phoenix, AZ
- Percentage point difference between wage & rent growth: -12.6
- Year-over-year change in wages: +3.5%
- Year-over-year change in rent: +16.1%
- Median rent (2021): $1,625
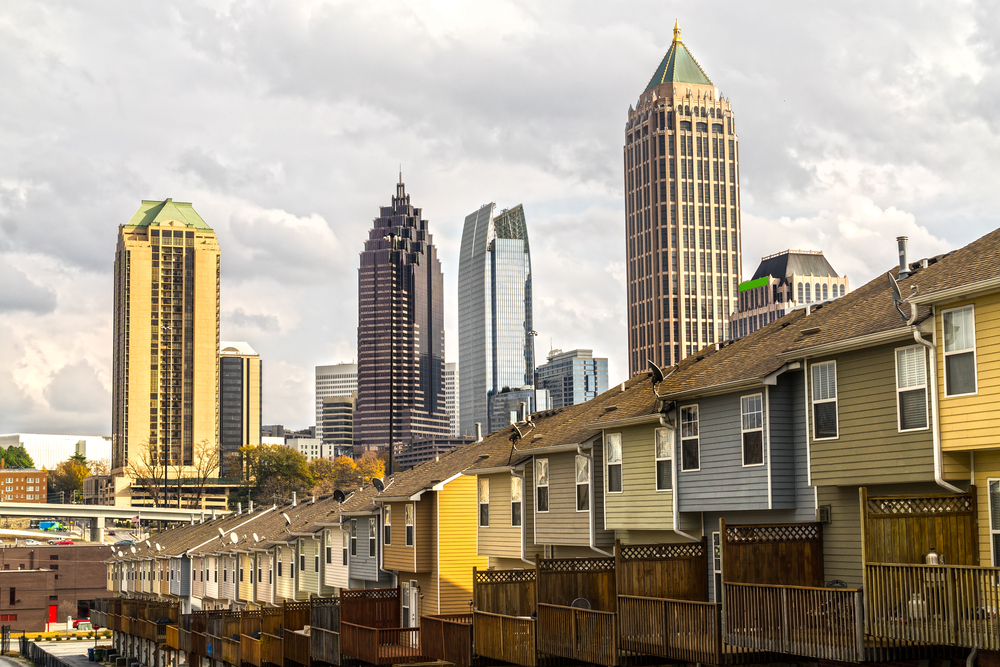
Photo Credit: Luciano Mortula – LGM / Shutterstock
14. Atlanta, GA
- Percentage point difference between wage & rent growth: -9.0
- Year-over-year change in wages: +3.4%
- Year-over-year change in rent: +12.4%
- Median rent (2021): $1,683

Photo Credit: Just dance / Shutterstock
13. Miami, FL
- Percentage point difference between wage & rent growth: -7.6
- Year-over-year change in wages: +2.9%
- Year-over-year change in rent: +10.5%
- Median rent (2021): $2,107
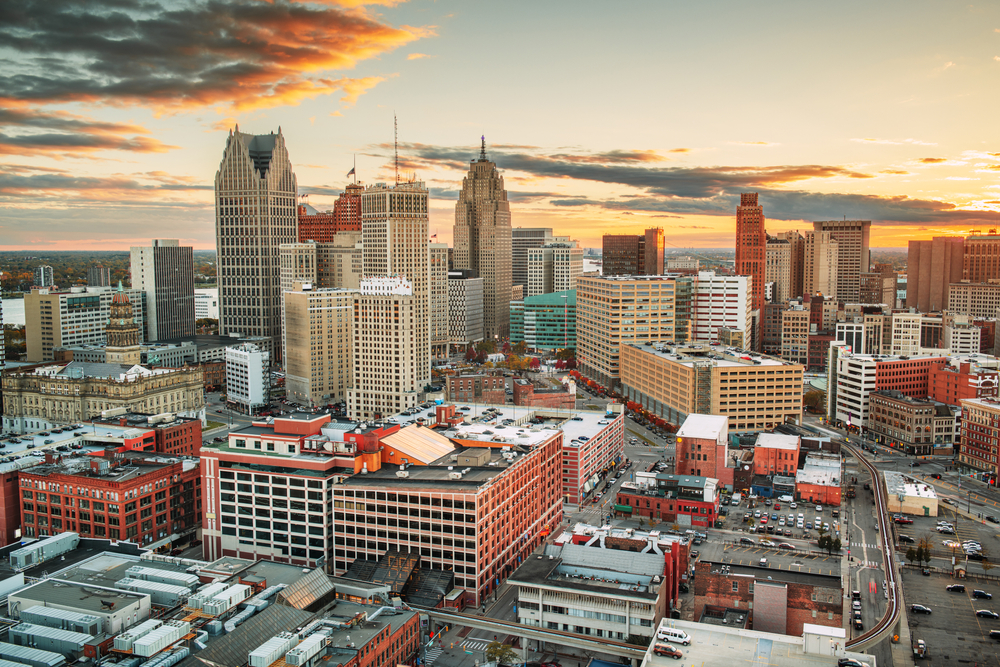
Photo Credit: Sean Pavone / Shutterstock
12. Detroit, MI
- Percentage point difference between wage & rent growth: -6.0
- Year-over-year change in wages: +2.8%
- Year-over-year change in rent: +8.8%
- Median rent (2021): $1,313

Photo Credit: Mihai_Andritoiu / Shutterstock
11. Dallas, TX
- Percentage point difference between wage & rent growth: -4.7
- Year-over-year change in wages: +3.0%
- Year-over-year change in rent: +7.7%
- Median rent (2021): $1,544

Photo Credit: RaulCano / Shutterstock
10. Houston, TX
- Percentage point difference between wage & rent growth: -2.4
- Year-over-year change in wages: +2.1%
- Year-over-year change in rent: +4.5%
- Median rent (2021): $1,419

Photo Credit: Sean Pavone / Shutterstock
9. Philadelphia, PA
- Percentage point difference between wage & rent growth: -0.4
- Year-over-year change in wages: +3.8%
- Year-over-year change in rent: +4.2%
- Median rent (2021): $1,650
Photo Credit: IVY PHOTOS / Shutterstock
8. Minneapolis, MN
- Percentage point difference between wage & rent growth: 0.0
- Year-over-year change in wages: +2.4%
- Year-over-year change in rent: +2.4%
- Median rent (2021): $1,559

Photo Credit: Jeremy Janus / Shutterstock
7. Seattle, WA
- Percentage point difference between wage & rent growth: +0.8
- Year-over-year change in wages: +2.4%
- Year-over-year change in rent: +1.6%
- Median rent (2021): $1,981

Photo Credit: marchello74 / Shutterstock
6. Chicago, IL
- Percentage point difference between wage & rent growth: +2.1
- Year-over-year change in wages: +3.0%
- Year-over-year change in rent: +0.9%
- Median rent (2021): $1,673

Photo Credit: Sean Pavone / Shutterstock
5. Los Angeles, CA
- Percentage point difference between wage & rent growth: +2.1
- Year-over-year change in wages: +5.4%
- Year-over-year change in rent: +3.3%
- Median rent (2021): $2,443

Photo Credit: f11photo / Shutterstock
4. Washington, DC
- Percentage point difference between wage & rent growth: +3.8
- Year-over-year change in wages: +4.3%
- Year-over-year change in rent: +0.5%
- Median rent (2021): $1,996

Photo Credit: Travellaggio / Shutterstock
3. Boston, MA
- Percentage point difference between wage & rent growth: +4.1
- Year-over-year change in wages: +3.6%
- Year-over-year change in rent: -0.5%
- Median rent (2021): $2,442

Photo Credit: Sean Pavone / Shutterstock
2. New York, NY
- Percentage point difference between wage & rent growth: +5.1
- Year-over-year change in wages: +2.3%
- Year-over-year change in rent: -2.8%
- Median rent (2021): $2,480

Photo Credit: Sundry Photography / Shutterstock
1. San Jose, CA
- Percentage point difference between wage & rent growth: +6.7
- Year-over-year change in wages: +3.4%
- Year-over-year change in rent: -3.3%
- Median rent (2021): $2,853
Methodology & Detailed Findings
The data used in this analysis is from the U.S. Bureau of Labor Statistics’ Employment Cost Trends survey and Zillow’s Zillow Observed Rent Index. To identify the metropolitan areas where wages are growing faster than rents, researchers calculated the percentage point difference between the year-over-year change in wages and the year-over-year change in rent for the period ending Q2 2021. In the event of a tie, the metro with the larger increase in wages was ranked higher. The wage data used is for all private industry wage and salary workers, and the rental price data used is for all rentals (seasonally adjusted). Only the 15 major U.S. metropolitan areas covered in the BLS survey were included in the analysis.