
The COVID-19 pandemic and its aftermath reshaped many aspects of life in the U.S., and how Americans eat and drink is no exception.
Disruptions in the initial months of COVID-19 forced food producers and distributors to adapt how food gets to consumers, and ongoing challenges with supply chains and the labor market have led to shortages at grocery stores. In the restaurant business, many restaurants have reoriented their businesses toward takeout and delivery, with the market for food delivery in the U.S. more than doubling during the pandemic.
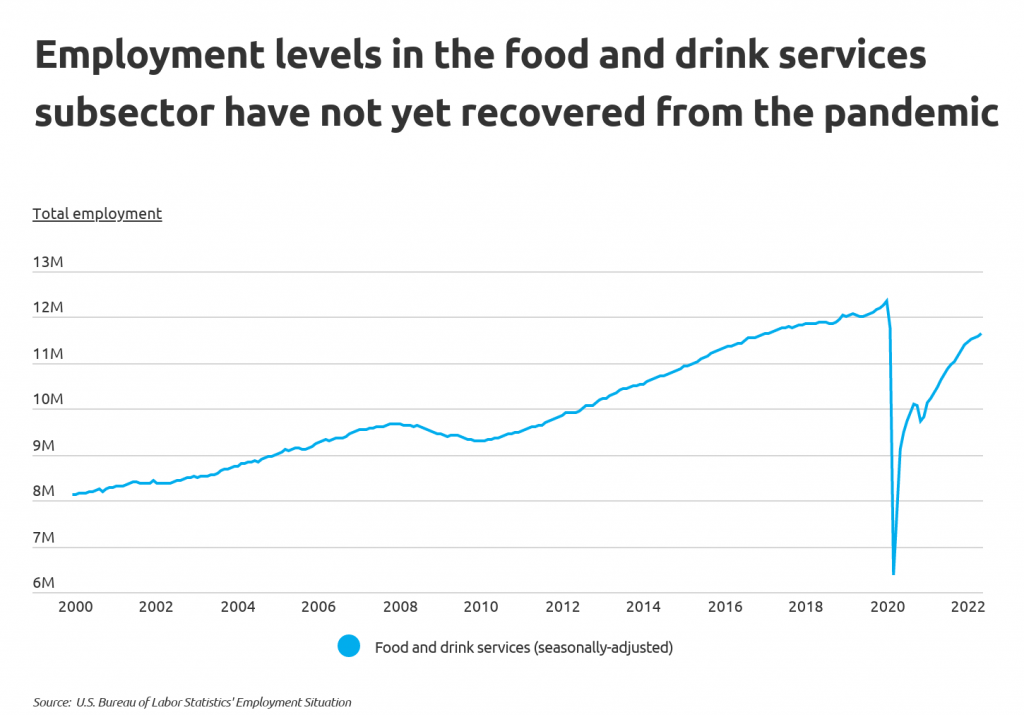
The latter trend came in response to major disruption to the foodservice industry from lockdowns and public health measures early in the pandemic. Bars and restaurants were among the businesses hit hardest by these policies. Unable to host patrons at full capacity, establishments drastically reduced their staffing and turned to takeout and delivery to continue operating while keeping costs low. Employment in the sector fell by nearly half in just two months, from 12.4 million in February 2020 to 6.4 million in April 2020. Even after public health restrictions loosened later in 2020, employment in the sector has been slow to recover. Today, the food and drink services industry employs 11.6 million people, well short of its pre-pandemic peaks.
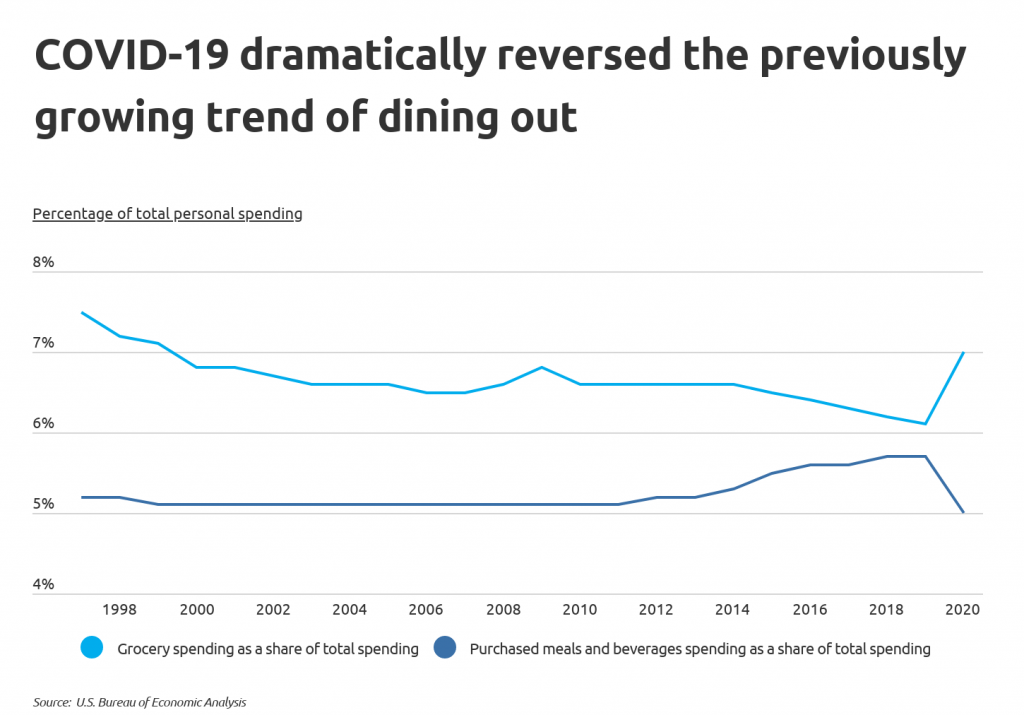
While the COVID lockdowns of 2020 provided an initial shock to the industry, shifting consumer preferences have also been a challenge for food service professionals. Bars and restaurants reopened over the course of 2020, but not all consumers rushed back. As fears around COVID persisted, many consumers have opted to spend more of their food budget on groceries for meals at home. This phenomenon quickly reversed trends in food spending over recent years. In 2020, spending on groceries as a share of total household spending reached its highest share in two decades, while spending on purchased meals and beverages fell to their lowest levels since the Great Recession.
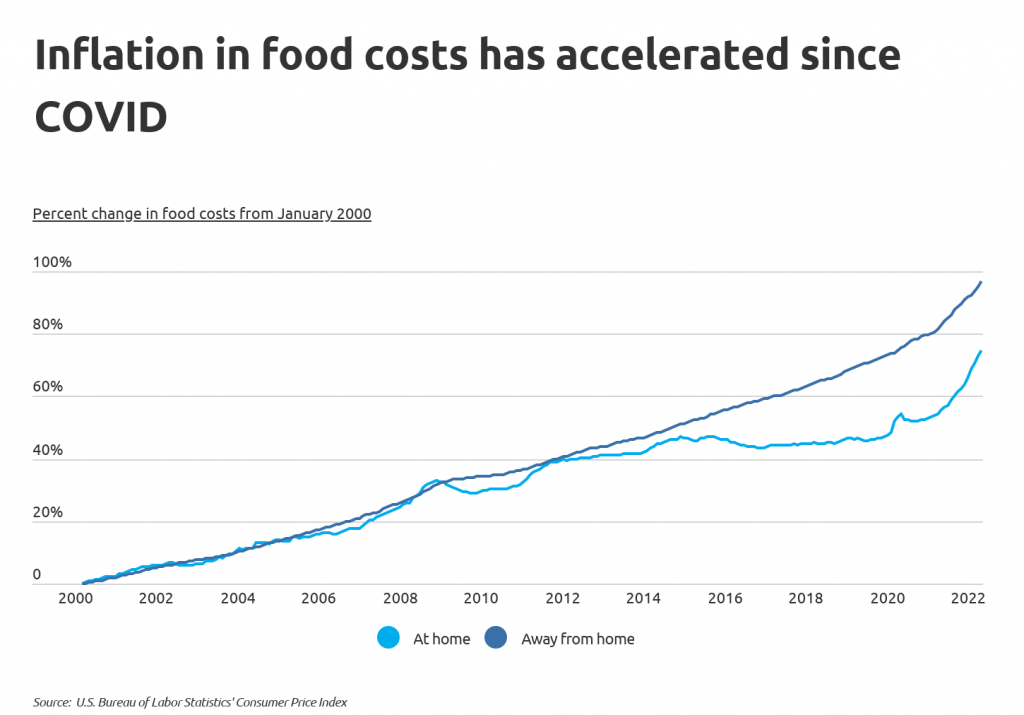
Time will tell how lasting changes in spending on food will be, especially in light of the high levels of inflation seen over the last year. While since the turn of the century, prices for food consumed at home grew more slowly than those for food consumed outside of the home, the opposite is true since the start of the pandemic. Since 2020, the Consumer Price Index (CPI) for food at home has risen by 18.2%, while the CPI for food away from home has grown by just 13.5% over the same span. The rate of price growth for food at home has been particularly stark after remaining roughly flat from 2014 to 2020. Though households in the pandemic have been more inclined to choose groceries over meals out, rapidly rising food prices have stretched household budgets as a result.
Inflation in the cost of food has been felt nationwide, but residents in some locations will feel the effects more than others. In states with lower incomes, especially in the South, residents spend a higher share of their overall household spending on food. Whether buying groceries or dining out, residents in these locations already struggle the most with food costs and will disproportionately feel the effects of inflation.
The data used in this analysis is from the U.S. Bureau of Economic Analysis. To determine the states where residents are spending the most on food, researchers on behalf of Self Financial calculated all food and beverage spending as a share of total spending. In the event of a tie, the state with the greater grocery spending as a share of total spending was ranked higher.
Here are the states where residents are spending the most on food.
States Where Residents Are Spending the Most on Food

Photo Credit: Ryan Conine / Shutterstock
15. Texas
- All food and beverage spending as a share of total spending: 12.8%
- Grocery spending as a share of total spending: 7.0%
- Purchased meals and beverages spending as a share of total spending: 5.8%
- Food and beverage spending per resident: $5,206
- Total spending per resident: $40,665
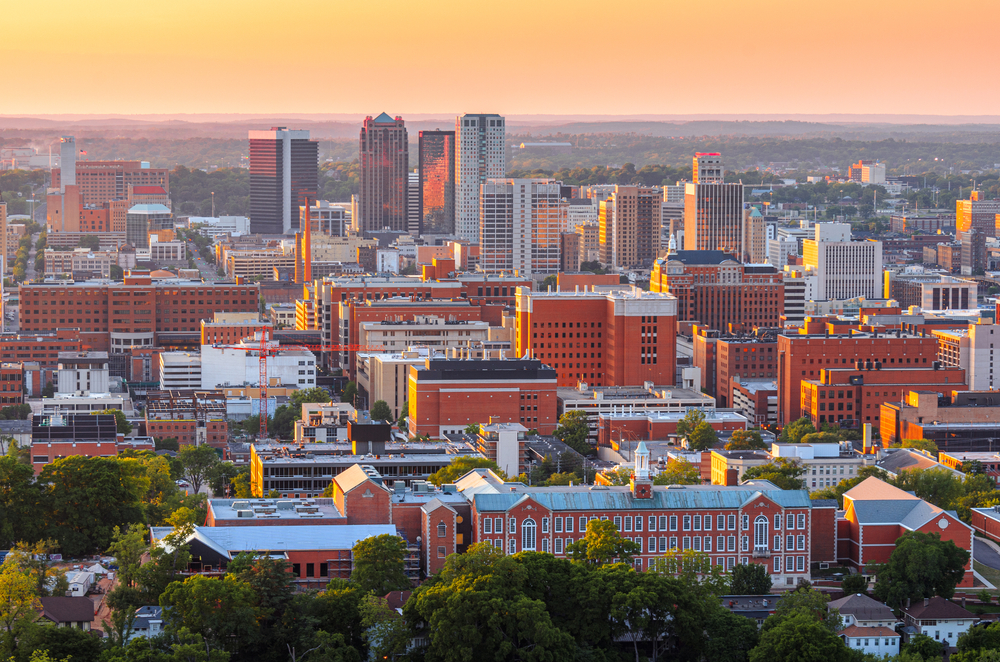
Photo Credit: Sean Pavone / Shutterstock
14. Alabama
- All food and beverage spending as a share of total spending: 12.8%
- Grocery spending as a share of total spending: 7.6%
- Purchased meals and beverages spending as a share of total spending: 5.2%
- Food and beverage spending per resident: $4,611
- Total spending per resident: $36,066

Photo Credit: Izabela23 / Shutterstock
13. Hawaii
- All food and beverage spending as a share of total spending: 12.8%
- Grocery spending as a share of total spending: 8.5%
- Purchased meals and beverages spending as a share of total spending: 4.3%
- Food and beverage spending per resident: $5,731
- Total spending per resident: $44,665

Photo Credit: ESB Professional / Shutterstock
12. Rhode Island
- All food and beverage spending as a share of total spending: 13.0%
- Grocery spending as a share of total spending: 7.1%
- Purchased meals and beverages spending as a share of total spending: 5.9%
- Food and beverage spending per resident: $5,569
- Total spending per resident: $42,917

Photo Credit: Jon Bilous / Shutterstock
11. North Carolina
- All food and beverage spending as a share of total spending: 13.0%
- Grocery spending as a share of total spending: 7.7%
- Purchased meals and beverages spending as a share of total spending: 5.3%
- Food and beverage spending per resident: $5,068
- Total spending per resident: $39,086

Photo Credit: Bob Pool / Shutterstock
10. Oregon
- All food and beverage spending as a share of total spending: 13.0%
- Grocery spending as a share of total spending: 7.8%
- Purchased meals and beverages spending as a share of total spending: 5.1%
- Food and beverage spending per resident: $5,542
- Total spending per resident: $42,711

Photo Credit: turtix / Shutterstock
9. New Mexico
- All food and beverage spending as a share of total spending: 13.0%
- Grocery spending as a share of total spending: 7.8%
- Purchased meals and beverages spending as a share of total spending: 5.2%
- Food and beverage spending per resident: $4,603
- Total spending per resident: $35,420

Photo Credit: Sean Pavone / Shutterstock
8. Maine
- All food and beverage spending as a share of total spending: 13.0%
- Grocery spending as a share of total spending: 8.3%
- Purchased meals and beverages spending as a share of total spending: 4.7%
- Food and beverage spending per resident: $5,906
- Total spending per resident: $45,587

Photo Credit: evenfh / Shutterstock
7. Louisiana
- All food and beverage spending as a share of total spending: 13.1%
- Grocery spending as a share of total spending: 7.5%
- Purchased meals and beverages spending as a share of total spending: 5.6%
- Food and beverage spending per resident: $4,859
- Total spending per resident: $37,199
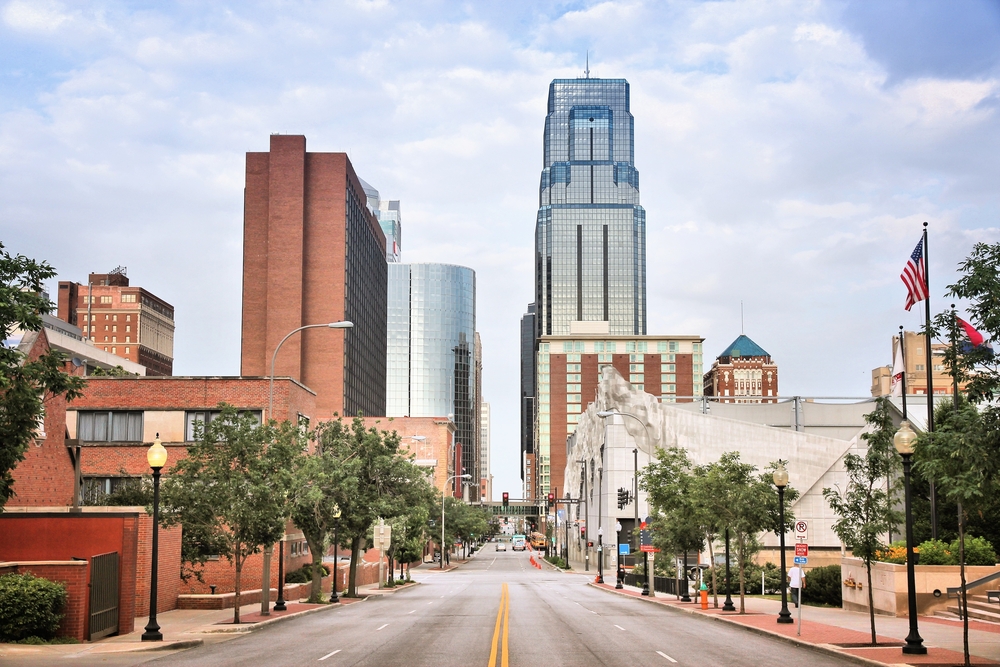
Photo Credit: Tupungato / Shutterstock
6. Kansas
- All food and beverage spending as a share of total spending: 13.1%
- Grocery spending as a share of total spending: 8.3%
- Purchased meals and beverages spending as a share of total spending: 4.8%
- Food and beverage spending per resident: $5,076
- Total spending per resident: $38,860
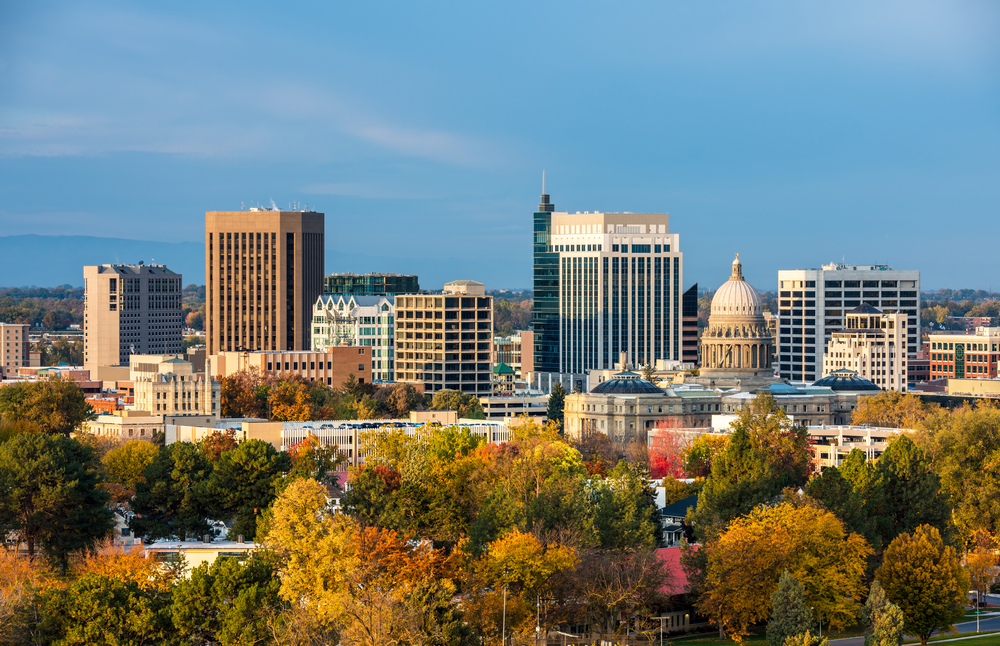
Photo Credit: Charles Knowles / Shutterstock
5. Idaho
- All food and beverage spending as a share of total spending: 13.2%
- Grocery spending as a share of total spending: 8.0%
- Purchased meals and beverages spending as a share of total spending: 5.3%
- Food and beverage spending per resident: $4,892
- Total spending per resident: $36,925

Photo Credit: AntonSokolov / Shutterstock
4. Georgia
- All food and beverage spending as a share of total spending: 13.3%
- Grocery spending as a share of total spending: 7.8%
- Purchased meals and beverages spending as a share of total spending: 5.5%
- Food and beverage spending per resident: $5,174
- Total spending per resident: $38,867

Photo Credit: Sean Pavone / Shutterstock
3. South Carolina
- All food and beverage spending as a share of total spending: 13.6%
- Grocery spending as a share of total spending: 7.9%
- Purchased meals and beverages spending as a share of total spending: 5.6%
- Food and beverage spending per resident: $5,230
- Total spending per resident: $38,487

Photo Credit: Steven Frame / Shutterstock
2. Kentucky
- All food and beverage spending as a share of total spending: 13.7%
- Grocery spending as a share of total spending: 8.6%
- Purchased meals and beverages spending as a share of total spending: 5.0%
- Food and beverage spending per resident: $5,010
- Total spending per resident: $36,699

Photo Credit: Sean Pavone / Shutterstock
1. Mississippi
- All food and beverage spending as a share of total spending: 14.3%
- Grocery spending as a share of total spending: 8.8%
- Purchased meals and beverages spending as a share of total spending: 5.5%
- Food and beverage spending per resident: $4,612
- Total spending per resident: $32,194
Detailed Findings & Methodology
The data used in this analysis is from the U.S. Bureau of Economic Analysis’ Consumer Spending 2020 report. To determine the states where residents are spending the most on food, researchers on behalf of Self Financial calculated all food and beverage spending as a share of total spending. In the event of a tie, the state with the greater grocery spending as a share of total spending was ranked higher. For the purposes of this study, grocery spending is defined as “food and nonalcoholic beverages purchased for off-premises consumption” from the Bureau of Economic Analysis. Percentage calculations in this analysis may not add up due to rounding.