As the fall season ushers in cooler temperatures and shorter days, it also marks the arrival of one of the most anticipated and celebrated holidays of the year: Halloween. Whether spending a night out trick-or-treating with friends, dressing up in costume for work, or simply decorating the house, Halloween in the U.S. offers something for nearly every age group.
According to data from the National Retail Federation (NRF), a staggering 73% of Americans plan to participate in Halloween-related activities this year, up from 69% in 2022. And with these levels of participation, it comes as no surprise that the holiday serves as a substantial economic driver for U.S. retail, ranking among the foremost shopping events of the year.
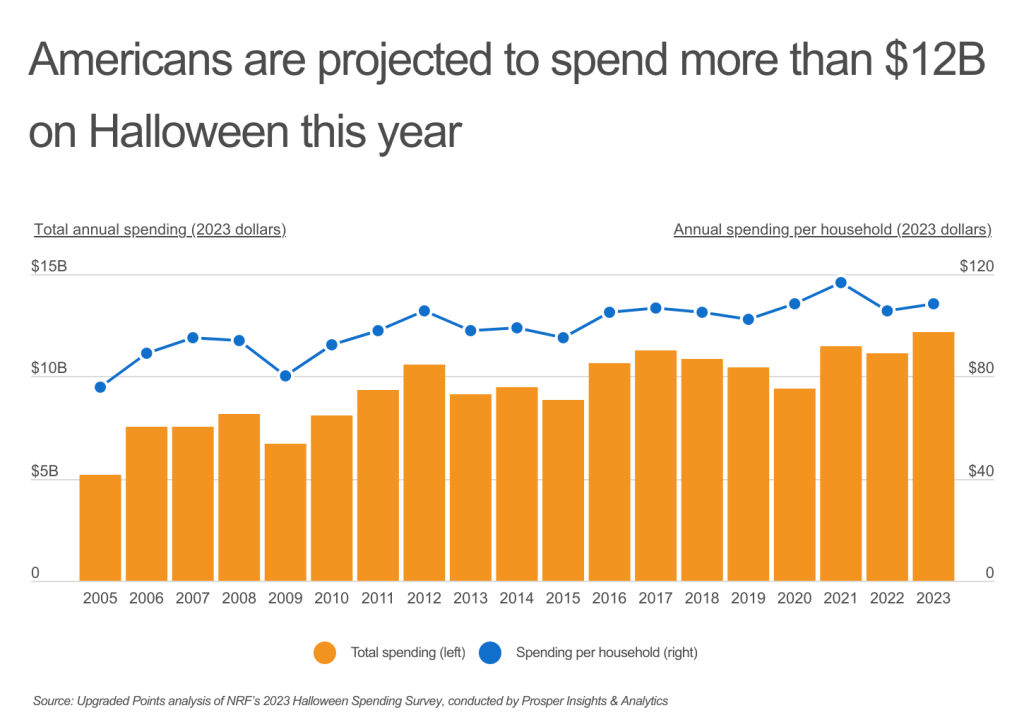
Americans are projected to spend over $12 billion in 2023 on Halloween, a number that has risen significantly over the past several years even after adjusting for inflation. For context, in 2005, Americans spent $3.3 billion (or an inflation-adjusted $5.2 billion in 2023 dollars). On a per-household basis, this equates to the average American household spending nearly $110 this year in preparation for October 31st.
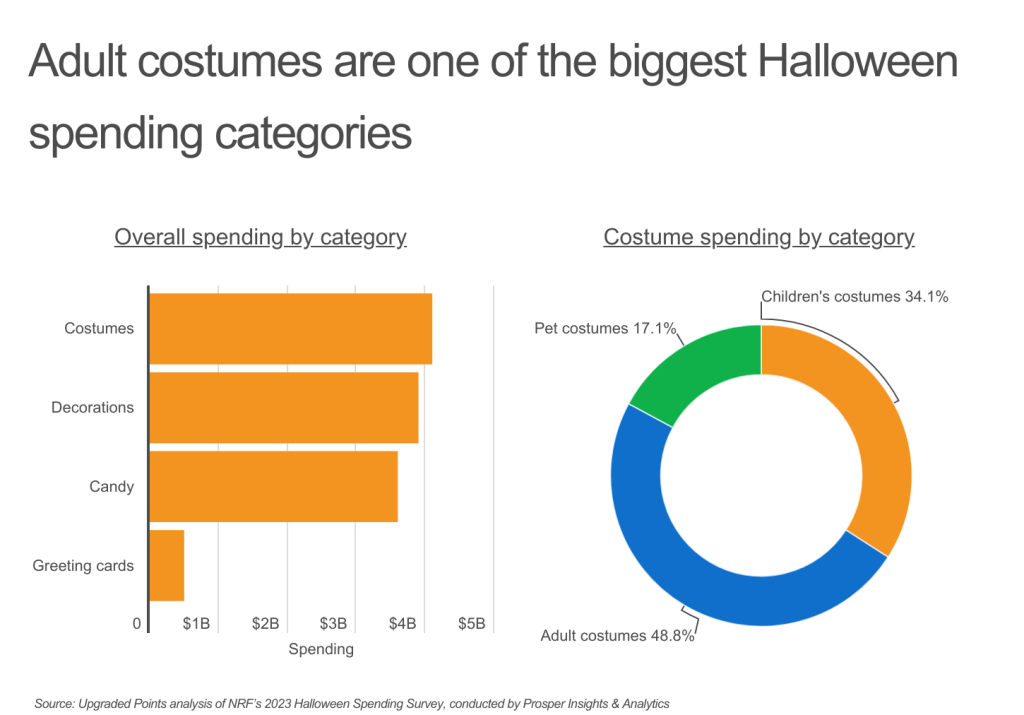
The largest spending categories for Halloween festivities are costumes, decorations, candy, and greeting cards. In 2023, the NRF projects Americans will spend a total of $4.1 billion (34% of total) on costumes, $3.9 billion (32% of total) on decorations, $3.6 billion (30% of total) on candy, and approximately $500 million (4% of total) on greeting cards. Interestingly, within the costume category, Americans typically spend more on costumes for adults than on costumes for kids. Adult costumes account for nearly half of costume spending, while costumes for children and pets represent just 34% and 17%, respectively.
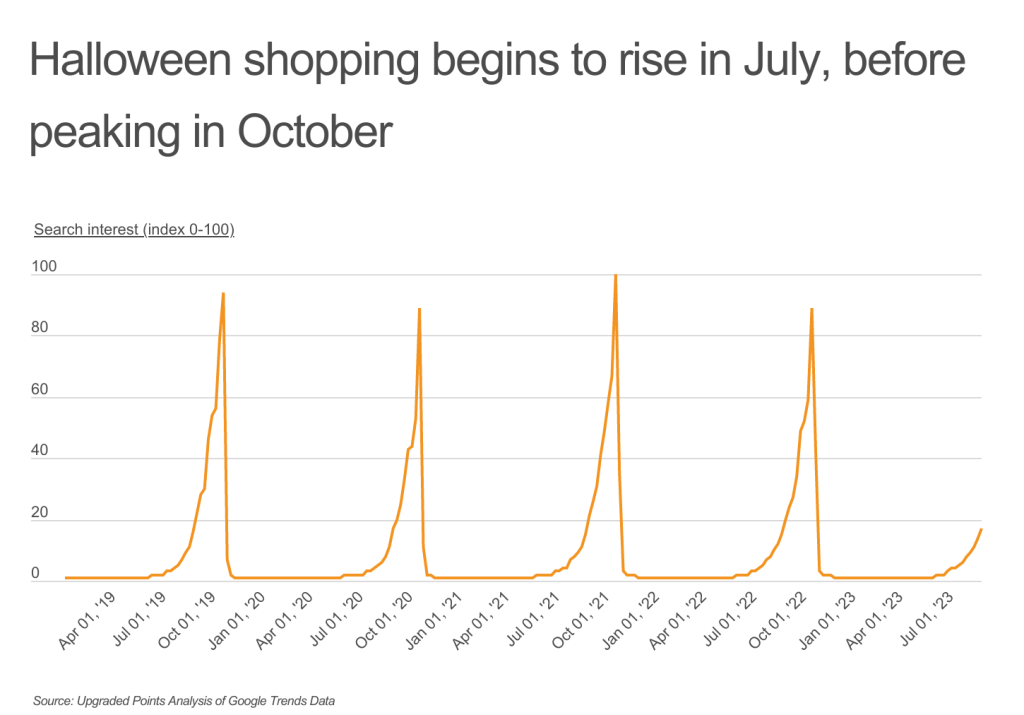
Just as certain radio stations begin airing Christmas music before Thanksgiving, certain Americans start prepping for Halloween long before October. According to data from Google Trends, internet shopping searches for Halloween items begin to inch up in July before growing exponentially to their peak at the end of October. While the majority of Halloween online shopping is performed in October, nearly 30% occurs in the three months prior (July–September). This number, however, varies by location.
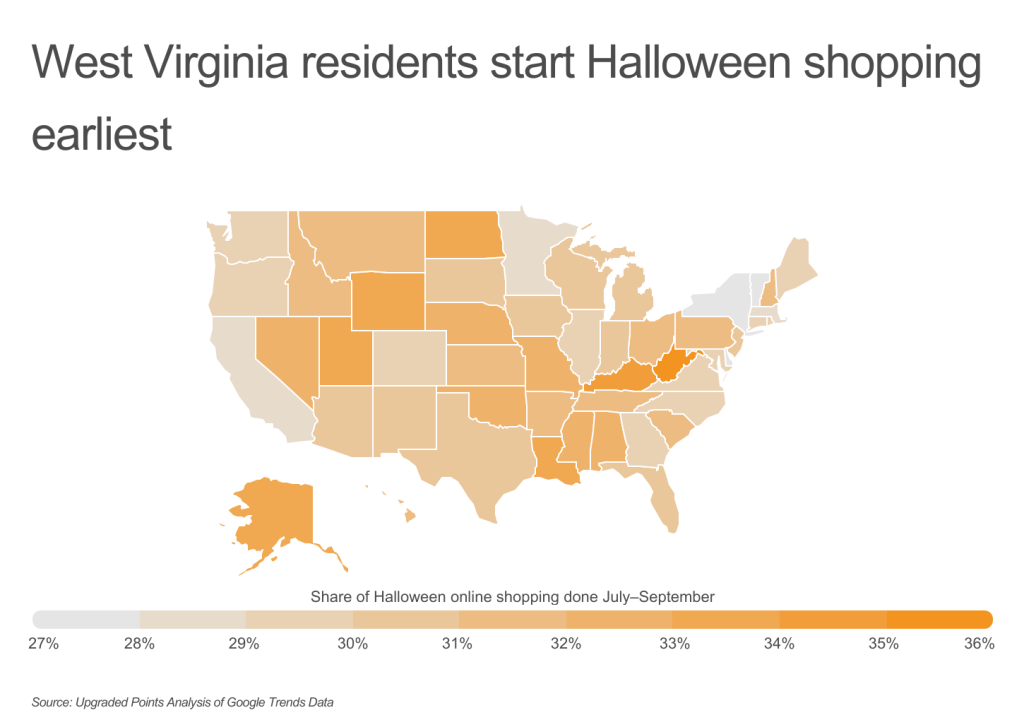
In West Virginia, nearly 36% of online shopping for Halloween supplies occurs between July and September—the highest of any state. Other states that prepare early for Halloween include Kentucky (34.3%), Alaska (33.8%), and Louisiana (33.7%). At the opposite end of the spectrum, only 27.2% of Halloween shopping takes place during the same three months in Vermont. Behind Vermont, Delaware (27.6%), New York (27.8%), California (28.0%), and Minnesota (28.1%) rounded out the bottom five. In these states, a larger share of Halloween shopping occurs in October.
To determine the states that start shopping for Halloween the earliest, researchers at Upgraded Points calculated the percentage of total Halloween shopping Google searches that occurred between July and September each year. In the event of a tie, researchers ranked states that performed more Halloween internet searches outside of October higher.
Here are the states that begin shopping for Halloween the earliest.
States That Begin Shopping for Halloween the Earliest
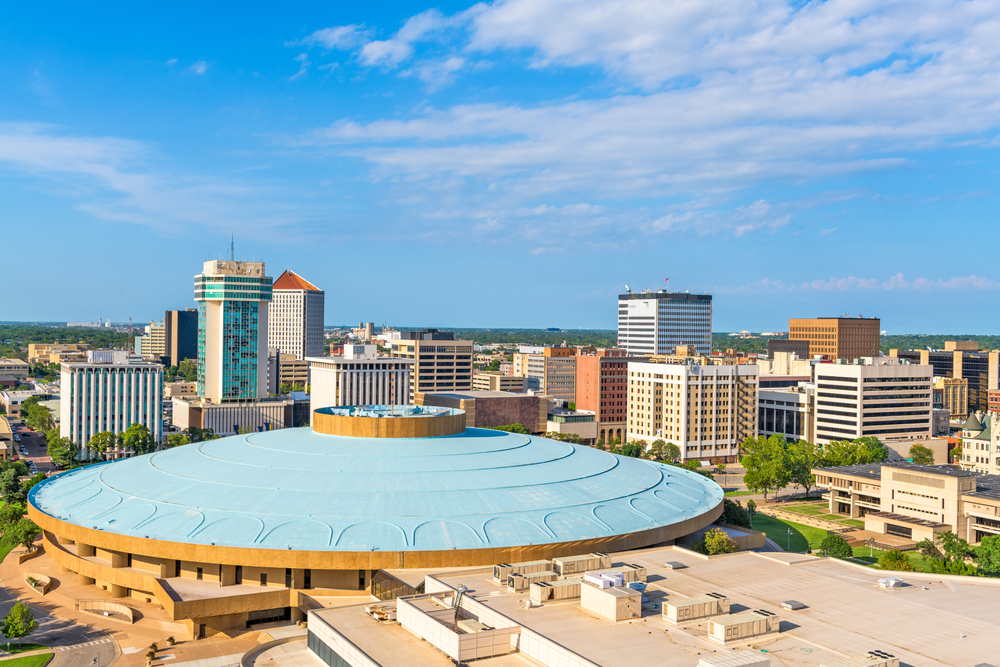
Photo Credit: Sean Pavone / Shutterstock
15. Kansas
- Share of Halloween online shopping done July–September: 31.8%
- Share of Halloween online shopping done in October: 58.9%
- Share of Halloween online shopping done the rest of the year: 9.3%
- Location with the most interest in Halloween: Pittsburg, KS

Photo Credit: Izabela23 / Shutterstock
14. Hawaii
- Share of Halloween online shopping done July–September: 31.8%
- Share of Halloween online shopping done in October: 57.4%
- Share of Halloween online shopping done the rest of the year: 10.7%
- Location with the most interest in Halloween: Honolulu, HI

Photo Credit: Andrey Bayda / Shutterstock
13. Nevada
- Share of Halloween online shopping done July–September: 32.1%
- Share of Halloween online shopping done in October: 57.0%
- Share of Halloween online shopping done the rest of the year: 10.9%
- Location with the most interest in Halloween: Salt Lake City UT
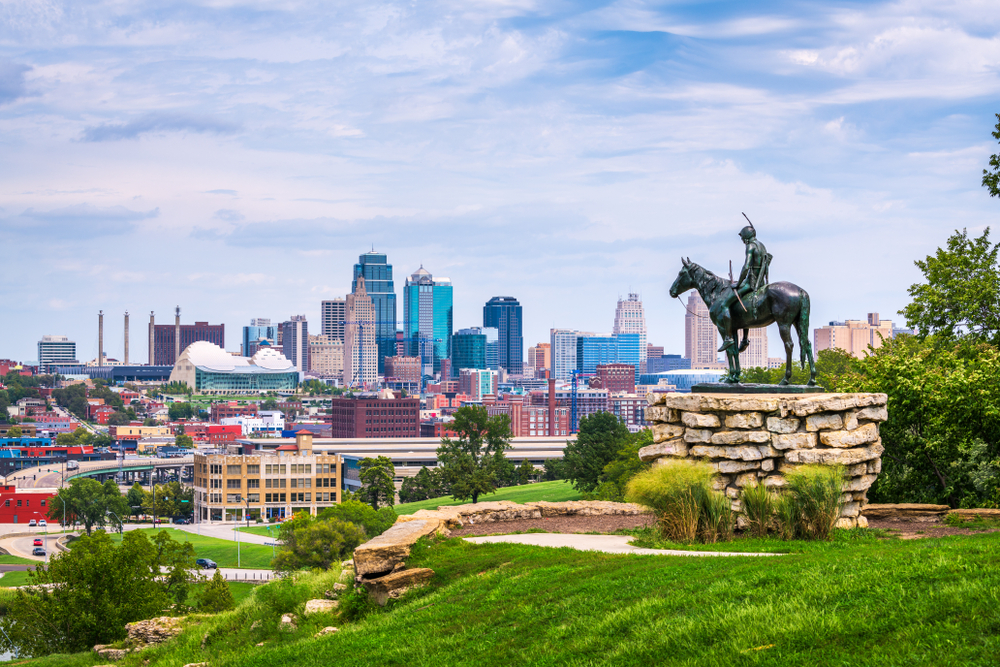
Photo Credit: Sean Pavone / Shutterstock
12. Missouri
- Share of Halloween online shopping done July–September: 32.3%
- Share of Halloween online shopping done in October: 58.7%
- Share of Halloween online shopping done the rest of the year: 9.0%
- Location with the most interest in Halloween: Cape Girardeau, MO

Photo Credit: Paul Brady Photography / Shutterstock
11. Nebraska
- Share of Halloween online shopping done July–September: 32.5%
- Share of Halloween online shopping done in October: 59.0%
- Share of Halloween online shopping done the rest of the year: 8.5%
- Location with the most interest in Halloween: Scottsbluff, NE
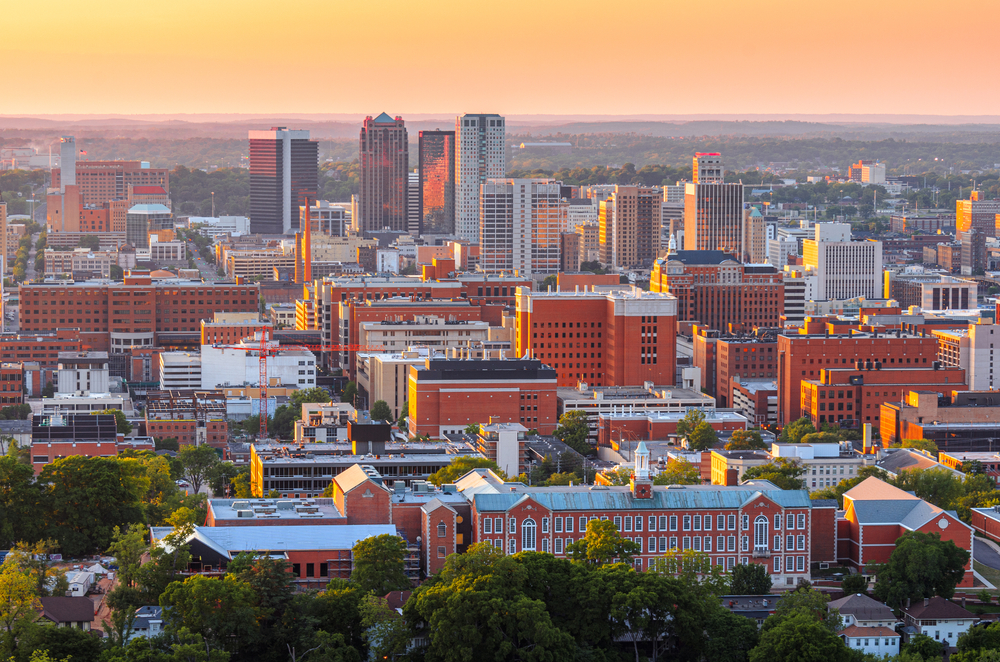
Photo Credit: Sean Pavone / Shutterstock
10. Alabama
- Share of Halloween online shopping done July–September: 32.5%
- Share of Halloween online shopping done in October: 58.4%
- Share of Halloween online shopping done the rest of the year: 9.1%
- Location with the most interest in Halloween: Birmingham, AL
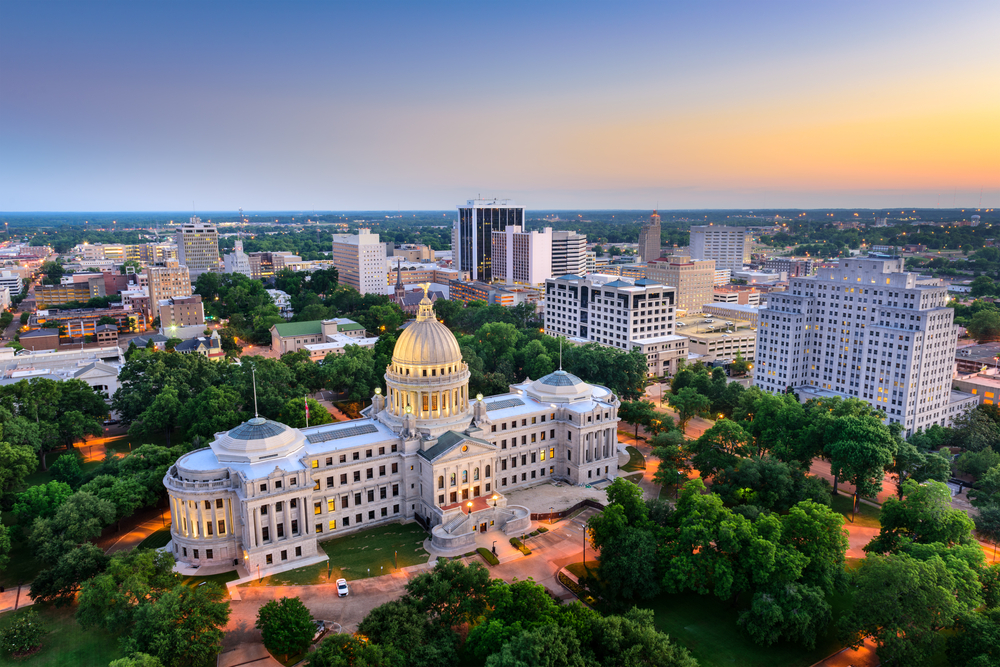
Photo Credit: Sean Pavone / Shutterstock
9. Mississippi
- Share of Halloween online shopping done July–September: 32.6%
- Share of Halloween online shopping done in October: 57.7%
- Share of Halloween online shopping done the rest of the year: 9.7%
- Location with the most interest in Halloween: Columbus, MS
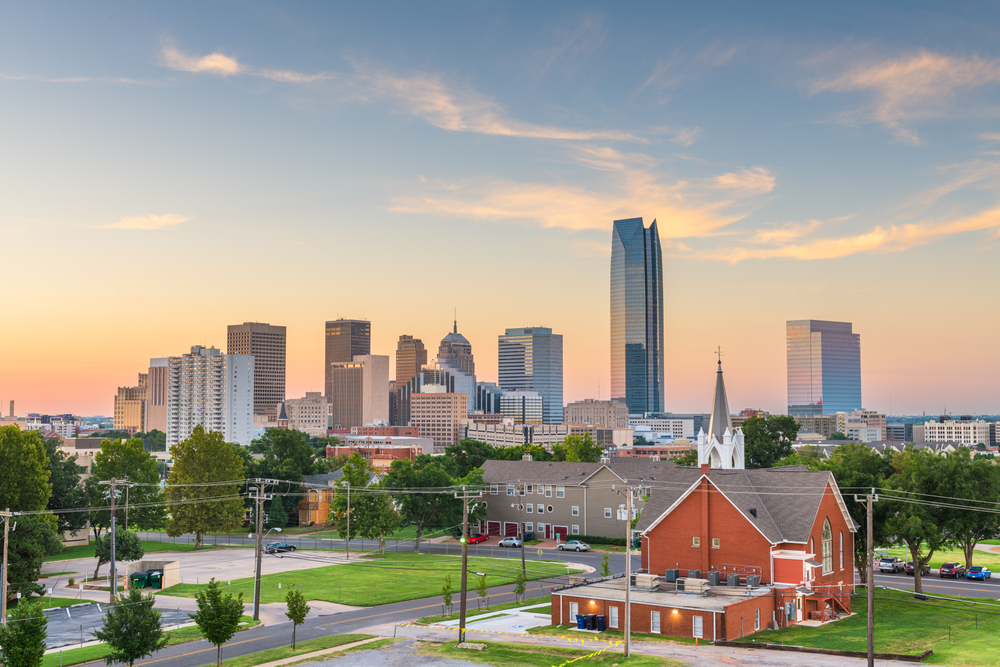
Photo Credit: Sean Pavone / Shutterstock
8. Oklahoma
- Share of Halloween online shopping done July–September: 32.7%
- Share of Halloween online shopping done in October: 58.7%
- Share of Halloween online shopping done the rest of the year: 8.6%
- Location with the most interest in Halloween: Oklahoma City, OK
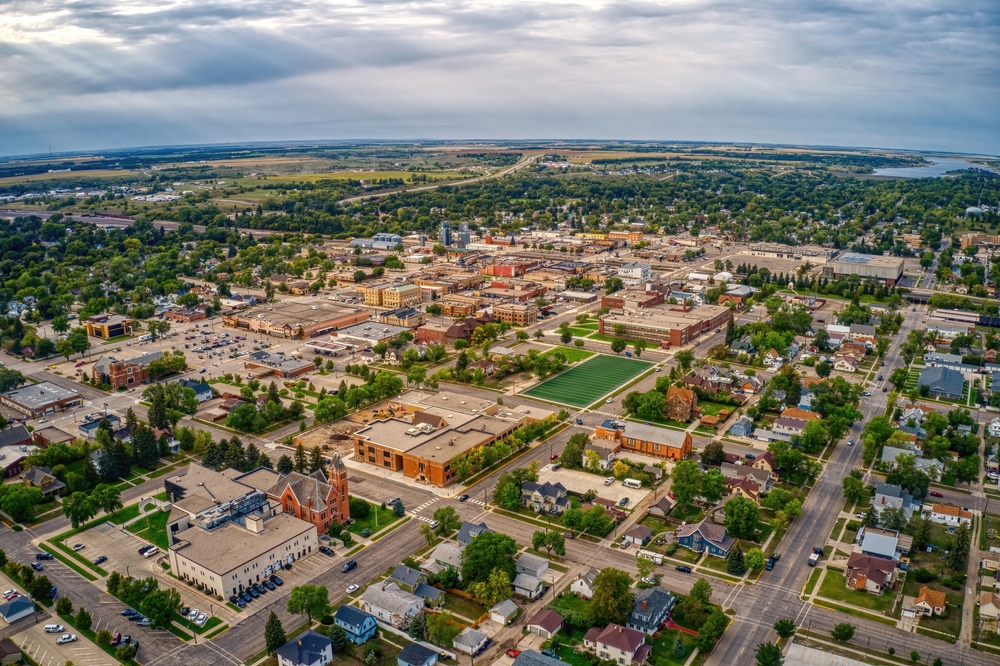
Photo Credit: Jacob Boomsma / Shutterstock
7. North Dakota
- Share of Halloween online shopping done July–September: 33.3%
- Share of Halloween online shopping done in October: 57.8%
- Share of Halloween online shopping done the rest of the year: 9.0%
- Location with the most interest in Halloween: Minot, ND

Photo Credit: Jacob Boomsma / Shutterstock
6. Wyoming
- Share of Halloween online shopping done July–September: 33.3%
- Share of Halloween online shopping done in October: 56.1%
- Share of Halloween online shopping done the rest of the year: 10.6%
- Location with the most interest in Halloween: Cheyenne, WY

Photo Credit: photo.ua / Shutterstock
5. Utah
- Share of Halloween online shopping done July–September: 33.6%
- Share of Halloween online shopping done in October: 57.9%
- Share of Halloween online shopping done the rest of the year: 8.5%
- Location with the most interest in Halloween: Salt Lake City, UT
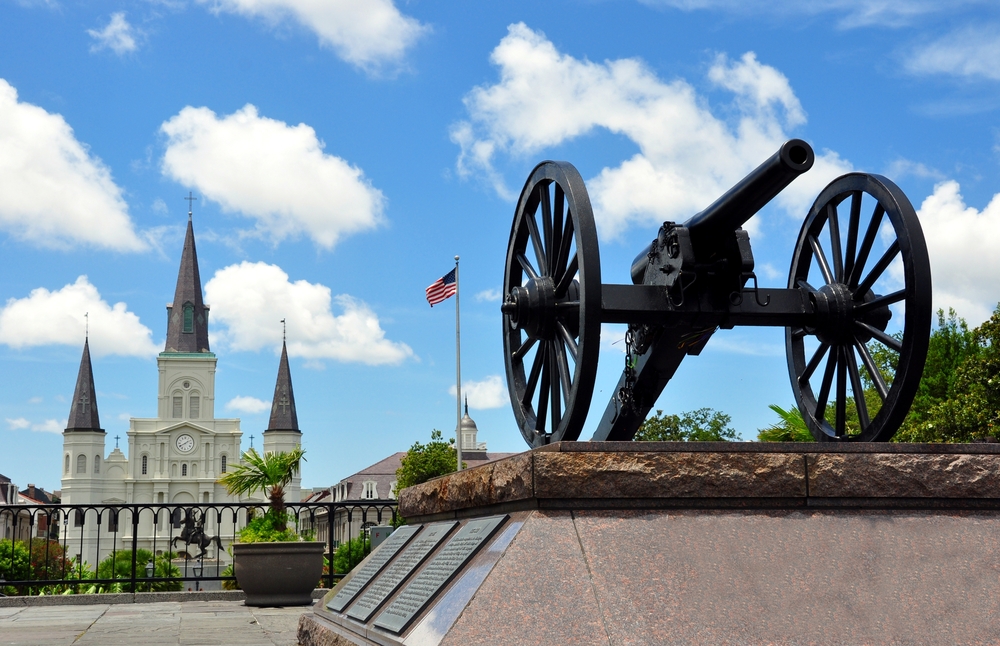
Photo Credit: Chuck Wagner / Shutterstock
4. Louisiana
- Share of Halloween online shopping done July–September: 33.7%
- Share of Halloween online shopping done in October: 56.9%
- Share of Halloween online shopping done the rest of the year: 9.4%
- Location with the most interest in Halloween: Baton Rouge, LA
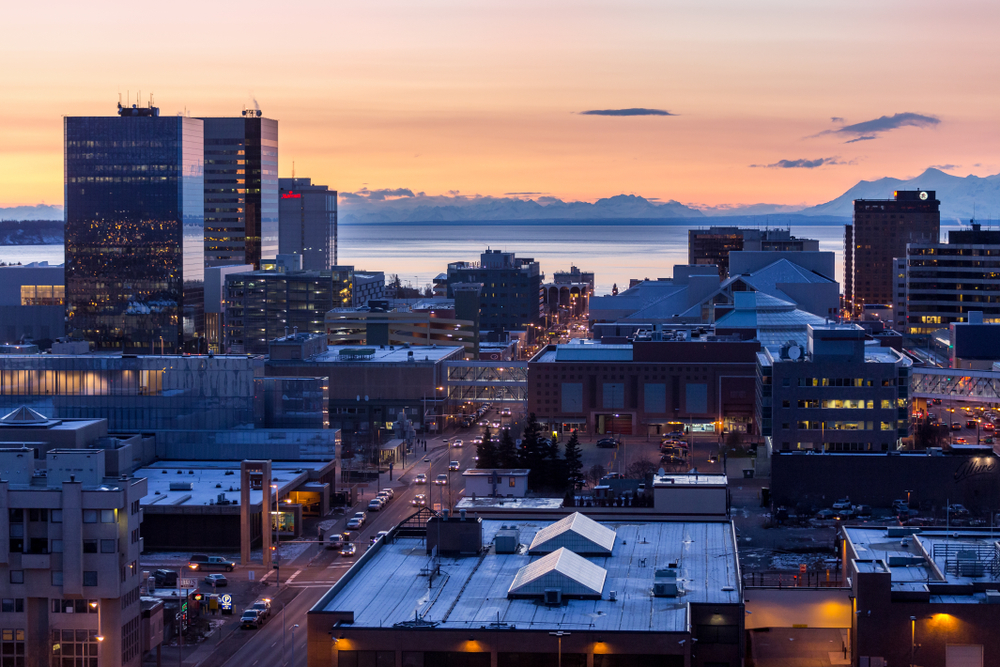
Photo Credit: Marcus Biastock / Shutterstock
3. Alaska
- Share of Halloween online shopping done July–September: 33.8%
- Share of Halloween online shopping done in October: 55.7%
- Share of Halloween online shopping done the rest of the year: 10.5%
- Location with the most interest in Halloween: Juneau, AK

Photo Credit: Sean Pavone / Shutterstock
2. Kentucky
- Share of Halloween online shopping done July–September: 34.3%
- Share of Halloween online shopping done in October: 56.6%
- Share of Halloween online shopping done the rest of the year: 9.1%
- Location with the most interest in Halloween: Bowling Green, KY
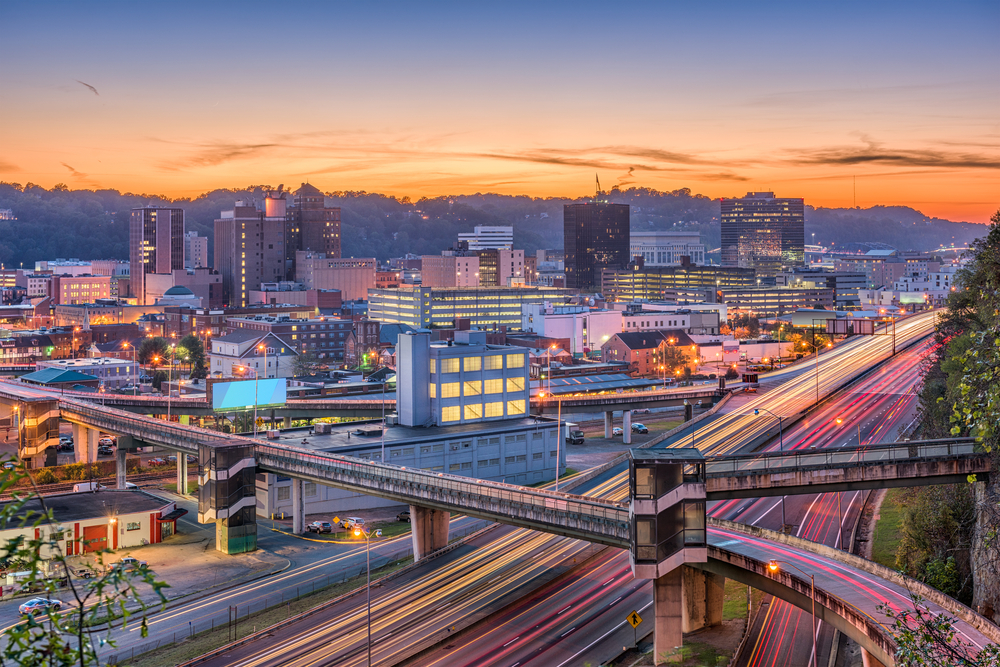
Photo Credit: Sean Pavone / Shutterstock
1. West Virginia
- Share of Halloween online shopping done July–September: 35.9%
- Share of Halloween online shopping done in October: 54.4%
- Share of Halloween online shopping done the rest of the year: 9.7%
- Location with the most interest in Halloween: Charleston, WV
Methodology & Detailed Findings
The state-level data used in this analysis is from Google Trends. To determine the states that start shopping for Halloween the earliest, researchers at Upgraded Points calculated the percentage of total Halloween-related shopping search queries on Google that occurred during the months of July, August, and September for each state. In the event of a tie, researchers ranked states that performed more online Halloween shopping queries outside of October higher. For each state, researchers also included the location with the greatest interest in Halloween, which is defined as the location where Halloween-related shopping queries represented the greatest proportion of all queries over the time period analyzed. To improve relevance, metro names were abbreviated to their predominant city name, and metros outside of the state of interest were not listed.
For complete results, see States That Start Shopping for Halloween the Earliest on Upgraded Points.