
For anyone seeking a promising career option with plenty of opportunity in the next few decades, becoming an electrician would be a good choice.
Electricians can enter the field without four-year degrees and can instead opt for a less expensive trade school education or an apprenticeship that allows them to earn while they hone their skills. Demand for electricians’ services is already strong, but the field also has bright prospects given recent technology and policy shifts. According to the Bureau of Labor Statistics, job opportunities in the field will grow significantly faster than the overall job growth rate as more of the nation’s energy infrastructure transitions to renewable sources. And like professionals in many other trades, electricians are well-compensated for their work, bringing in a median annual wage of more than $60,240 as of 2022.
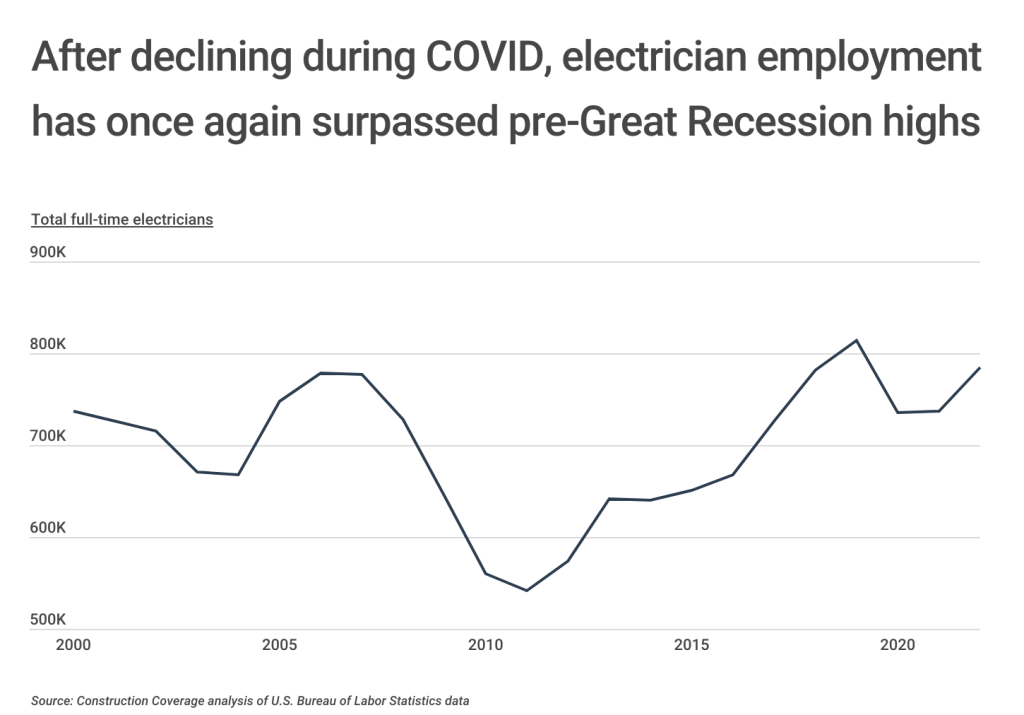
Despite the growth opportunities moving forward, one downside to a career as an electrician is that employment in the profession is tightly correlated to larger economic trends. When the economy is booming, the demand for electricians rises with increased activity in industry and especially construction. But when the economy struggles, jobs in the field disappear. Recent history shows this trend: the Great Recession set off massive declines in employment for electricians, but from a low point in 2011, the field grew by over 50% to surpass pre-Great Recession levels in 2019. Similarly, electrician employment dipped during the COVID-19 pandemic, but has since shown signs of recovering.
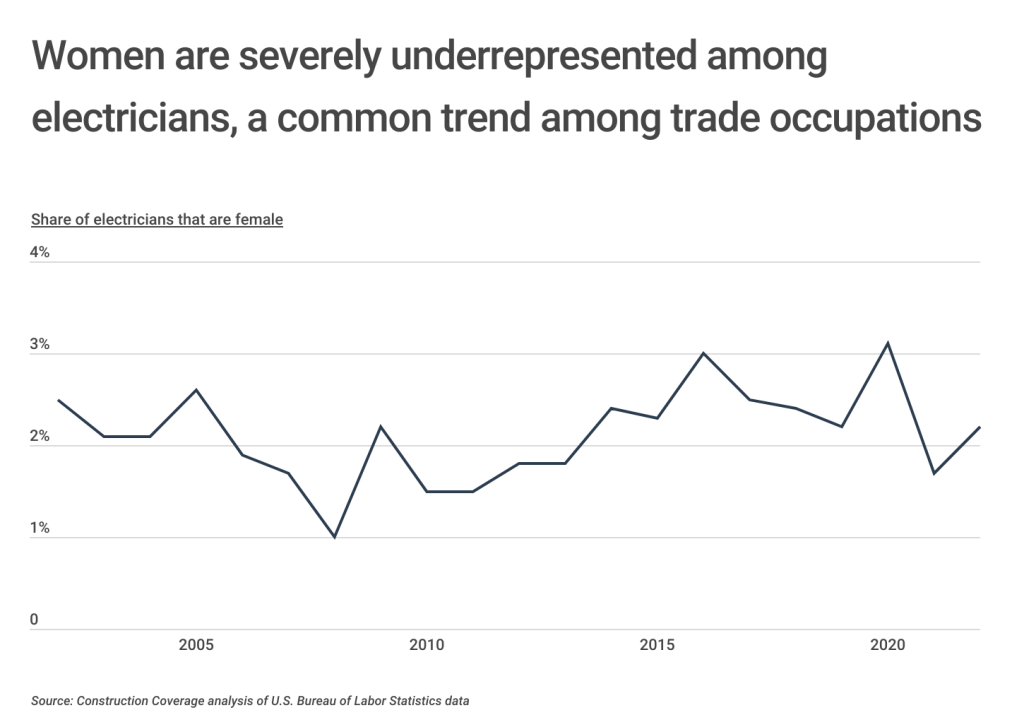
The strength of the electrician profession is not consistent across demographics, and the biggest gap in this regard is by gender. Women consistently represent roughly 3% or less of the profession, and the share took a hit during the pandemic. But this pattern is not unusual among building trades: recent BLS data shows that women account for 5% or less of carpenters, plumbers, roofers, and masons.
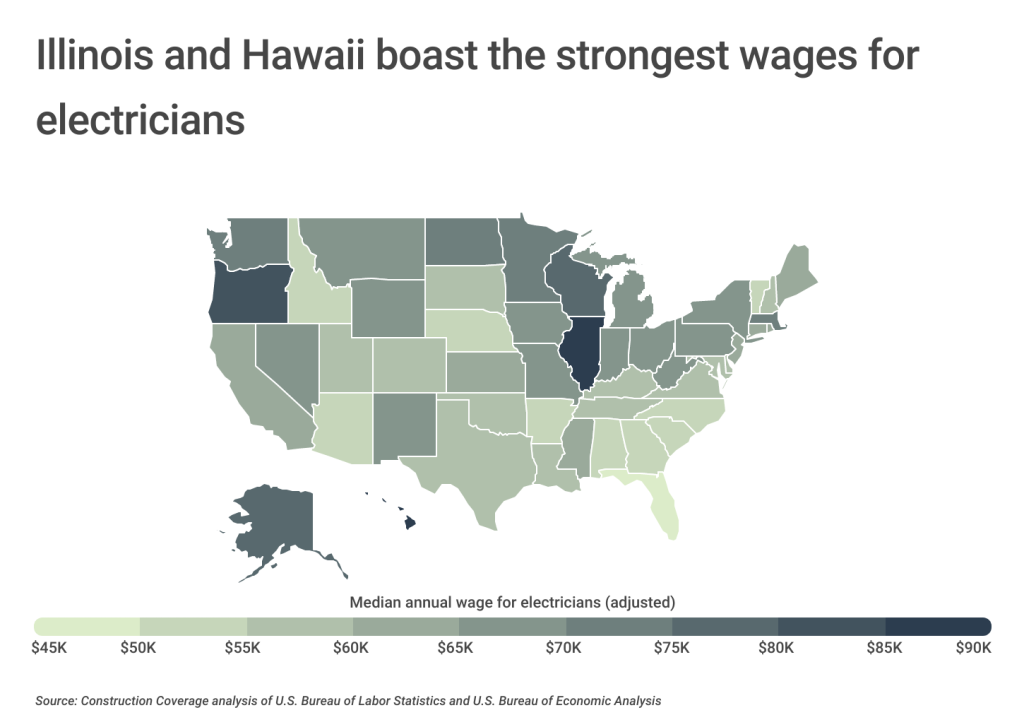
Location is also a significant factor in the job and earning prospects for electricians. In general, Midwestern states have some of the best wages for electricians after adjusting for cost of living, led by Illinois at an adjusted median annual wage of $87,633. This is partially attributable to cost differences, as many Midwestern states are less expensive to live in than their coastal counterparts, but these differences do not tell the whole story.
Instead, factors like industry mix and union strength may be the key factors that drive electricians’ wages. For instance, the fourth best-paying state for electricians, Alaska, has one of the nation’s highest unionization rates, along with a large oil and gas extraction industry that requires highly skilled electricians to keep equipment running safely and efficiently. Top-paying states in the Midwest similarly have stronger unions and manufacturing-driven economies that rely on skilled industrial electricians. Meanwhile, lower-paying states in the South have much weaker labor unions and economies more likely to be driven by agriculture or other industries where electricians’ services are less critical. Among the 15 worst-paying states for electricians, about half are in the South.
The same factors are at play at the metro level, and accordingly, locations in Florida and Texas are overrepresented among the lowest-paying metropolitan areas for electricians, even when factoring in the states’ lower living costs. On the other hand, locations in Illinois—like Chicago, Peoria, Decatur, and Champaign—stand out as offering some of the best compensation for the nation’s electricians.
Below is a complete breakdown of cost-of-living-adjusted electrician pay across more than 300 metropolitan areas (grouped by size) and all 50 states. The analysis was conducted by researchers at Construction Coverage, a website that provides construction software and insurance reviews, using data from the U.S. Bureau of Labor Statistics and the U.S. Bureau of Economic Analysis. For more information, refer to the methodology section.
Here are the best-paying U.S. metropolitan areas for electricians.

Best-Paying Large Metros for Electricians

Photo Credit: ESB Professional / Shutterstock
15. Pittsburgh, PA
- Median annual wage for electricians (adjusted): $66,272
- Median annual wage for electricians (actual): $63,060
- Median annual wage for all workers (actual): $45,870
- Relative concentration of electricians (compared to average): -15%
- Relative cost of living (compared to average): -4.8%

Photo Credit: Sirichai netthong / Shutterstock
14. Rochester, NY
- Median annual wage for electricians (adjusted): $66,520
- Median annual wage for electricians (actual): $64,980
- Median annual wage for all workers (actual): $47,010
- Relative concentration of electricians (compared to average): +8%
- Relative cost of living (compared to average): -2.3%

Photo Credit: Victor Moussa / Shutterstock
13. New York-Newark-Jersey City, NY-NJ-PA
- Median annual wage for electricians (adjusted): $67,246
- Median annual wage for electricians (actual): $77,050
- Median annual wage for all workers (actual): $57,390
- Relative concentration of electricians (compared to average): -10%
- Relative cost of living (compared to average): +14.6%

Photo Credit: Sean Pavone / Shutterstock
12. Kansas City, MO-KS
- Median annual wage for electricians (adjusted): $67,519
- Median annual wage for electricians (actual): $63,240
- Median annual wage for all workers (actual): $46,410
- Relative concentration of electricians (compared to average): -4%
- Relative cost of living (compared to average): -6.3%

Photo Credit: Andrey Bayda / Shutterstock
11. Las Vegas-Henderson-Paradise, NV
- Median annual wage for electricians (adjusted): $68,021
- Median annual wage for electricians (actual): $64,990
- Median annual wage for all workers (actual): $39,060
- Relative concentration of electricians (compared to average): +1%
- Relative cost of living (compared to average): -4.5%

Photo Credit: Darlene Munro / Shutterstock
10. Detroit-Warren-Dearborn, MI
- Median annual wage for electricians (adjusted): $68,526
- Median annual wage for electricians (actual): $65,860
- Median annual wage for all workers (actual): $48,000
- Relative concentration of electricians (compared to average): +43%
- Relative cost of living (compared to average): -3.9%

Photo Credit: Kenny Tong / Shutterstock
9. St. Louis, MO-IL
- Median annual wage for electricians (adjusted): $71,702
- Median annual wage for electricians (actual): $69,010
- Median annual wage for all workers (actual): $45,990
- Relative concentration of electricians (compared to average): -11%
- Relative cost of living (compared to average): -3.8%

Photo Credit: Travellaggio / Shutterstock
8. Boston-Cambridge-Nashua, MA-NH
- Median annual wage for electricians (adjusted): $72,778
- Median annual wage for electricians (actual): $79,830
- Median annual wage for all workers (actual): $61,090
- Relative concentration of electricians (compared to average): +10%
- Relative cost of living (compared to average): +9.7%

Photo Credit: S.Borisov / Shutterstock
7. Philadelphia-Camden-Wilmington, PA-NJ-DE-MD
- Median annual wage for electricians (adjusted): $72,795
- Median annual wage for electricians (actual): $72,220
- Median annual wage for all workers (actual): $48,420
- Relative concentration of electricians (compared to average): -22%
- Relative cost of living (compared to average): -0.8%

Photo Credit: Checubus / Shutterstock
6. Seattle-Tacoma-Bellevue, WA
- Median annual wage for electricians (adjusted): $74,881
- Median annual wage for electricians (actual): $85,790
- Median annual wage for all workers (actual): $61,830
- Relative concentration of electricians (compared to average): +6%
- Relative cost of living (compared to average): +14.6%

Photo Credit: Dave Riewe / Shutterstock
5. Minneapolis-St. Paul-Bloomington, MN-WI
- Median annual wage for electricians (adjusted): $75,061
- Median annual wage for electricians (actual): $77,750
- Median annual wage for all workers (actual): $50,960
- Relative concentration of electricians (compared to average): -16%
- Relative cost of living (compared to average): +3.6%

Photo Credit: Uladzik Kryhin / Shutterstock
4. San Jose-Sunnyvale-Santa Clara, CA
- Median annual wage for electricians (adjusted): $83,569
- Median annual wage for electricians (actual): $93,300
- Median annual wage for all workers (actual): $76,740
- Relative concentration of electricians (compared to average): -10%
- Relative cost of living (compared to average): +11.6%

Photo Credit: Dave H. Fine / Shutterstock
3. Urban Honolulu, HI
- Median annual wage for electricians (adjusted): $86,047
- Median annual wage for electricians (actual): $98,730
- Median annual wage for all workers (actual): $49,660
- Relative concentration of electricians (compared to average): +39%
- Relative cost of living (compared to average): +14.7%

Photo Credit: Andrew Zarivny / Shutterstock
2. Portland-Vancouver-Hillsboro, OR-WA
- Median annual wage for electricians (adjusted): $87,813
- Median annual wage for electricians (actual): $92,530
- Median annual wage for all workers (actual): $50,860
- Relative concentration of electricians (compared to average): +22%
- Relative cost of living (compared to average): +5.4%

Photo Credit: Oleg Podzorov / Shutterstock
1. Chicago-Naperville-Elgin, IL-IN-WI
- Median annual wage for electricians (adjusted): $92,918
- Median annual wage for electricians (actual): $97,950
- Median annual wage for all workers (actual): $48,340
- Relative concentration of electricians (compared to average): -27%
- Relative cost of living (compared to average): +5.4%
Methodology & Detailed Findings
To determine the best-paying metros for electricians, researchers at Construction Coverage analyzed the latest data from the U.S. Bureau of Labor Statistics’s 2022 Occupational Employment and Wage Statistics and the U.S. Bureau of Economic Analysis’ 2021 Regional Price Parities. The researchers ranked metropolitan areas according to the cost-of-living adjusted median annual wage for electricians. In the event of a tie, the location with the larger unadjusted median annual wage for electricians was ranked higher.
Only metropolitan areas with available data and with at least 100,000 people were included in the analysis. The cost of living for New England City and Town Areas (NECTAs) was calculated using data for equivalent Metropolitan Statistical Areas (MSAs), where applicable. Additionally, metro areas were grouped into the following cohorts based on population size:
- Small metros: 100,000–349,999
- Midsize metros: 350,000–999,999
- Large metros: 1,000,000 or more
Fore complete results, see The Best-Paying U.S. Cities for Electricians on Construction Coverage.