
Photo Credit: fizkes / Shutterstock
The U.S. has long been known for its diversity relative to other nations. For hundreds of years, migration and growth have brought people of countless different backgrounds to the American melting pot. And the U.S. today is only growing more diverse over time, and frequently in new ways.
Diversity in the population can have a number of definitions or interpretations, which has made it complicated for demographers to measure. Individuals who identify as some kind of racial or ethnic minority have become an increasing share of the population, but people increasingly have multiracial or multiethnic identities as well. And within different racial or ethnic categories, birthplace and migration history or ancestry can also affect how people identify and how they experience their identity day-to-day.
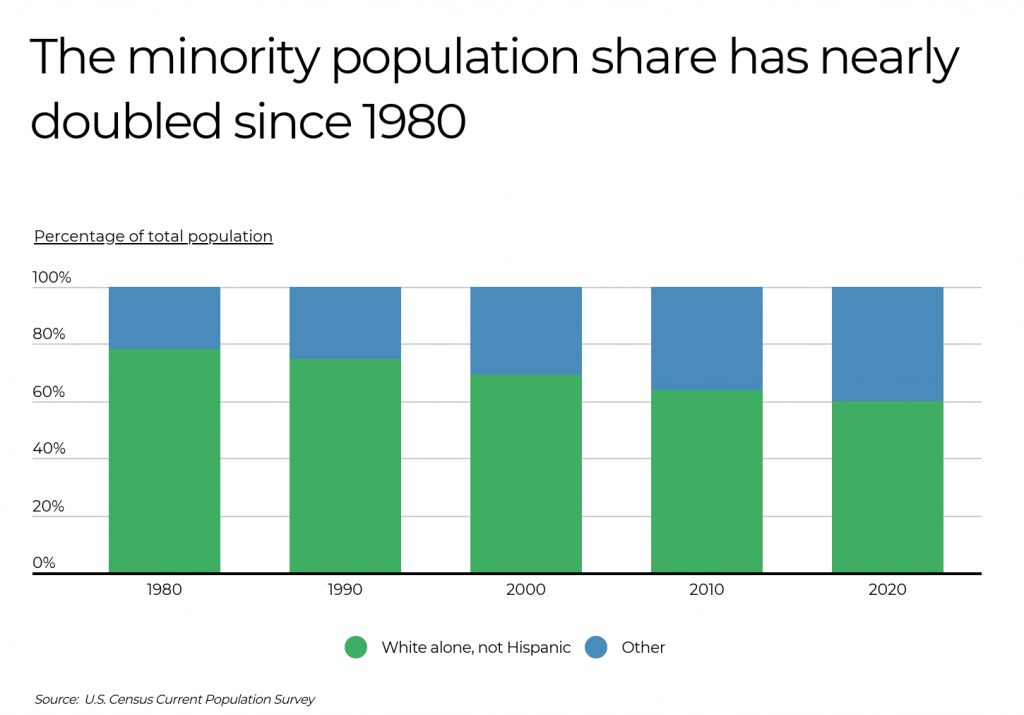
At a high level, however, one simple but significant sign of the diversification of the U.S. population is the decreasing share of people who identify as White alone, not Hispanic. This category represented 59.9% of the U.S. population in 2020, down from 64% in 2010 and 78.2% in 1980. In a handful of states, non-Hispanic Whites now represent less than half of the population, and demographers anticipate that the U.S. as a whole is likely to become “majority-minority” sometime in the 2040s.
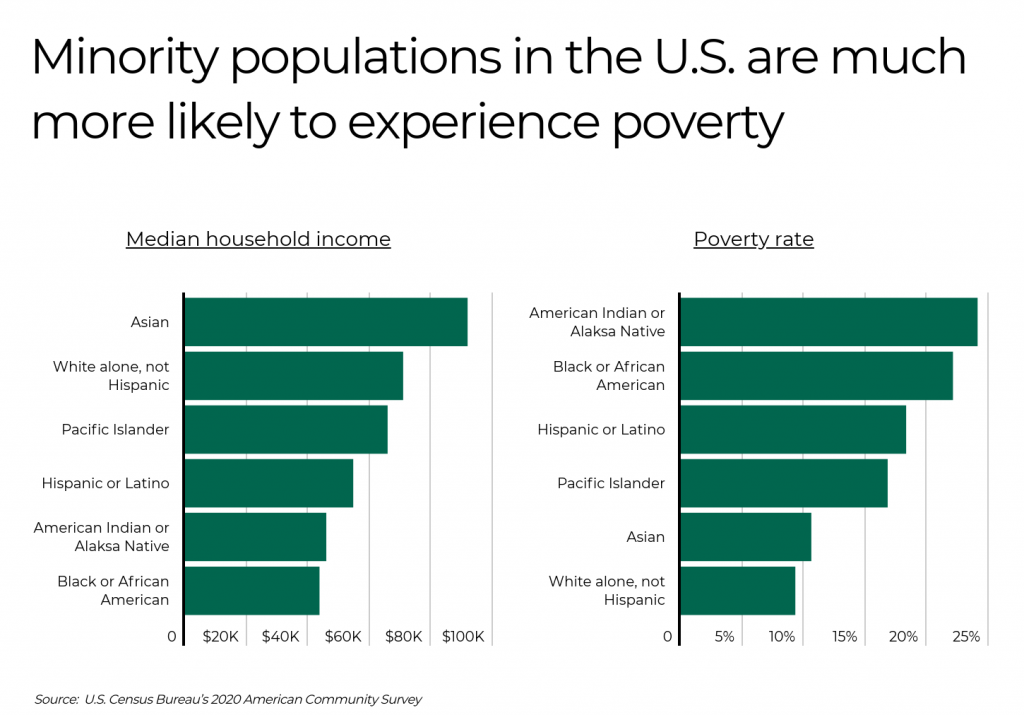
Despite America’s rapidly diversifying population, reducing economic inequality across demographic groups remains a key issue among policymakers. People identifying as Black and American Indian have historically fared worst. Black American households have the lowest median income of any group at $43,674 and American Indian households are second-lowest at $45,877. With regards to poverty, American Indians lead all groups with a poverty rate of 24.1%, followed by Black Americans at 22.1%. In contrast, Asian Americans tend to fare better economically than members of other racial and ethnic minority groups, with a median household income of $91,775 (highest among all groups, including Whites) and a poverty rate of 10.6% (second only to Whites at 9.3%).
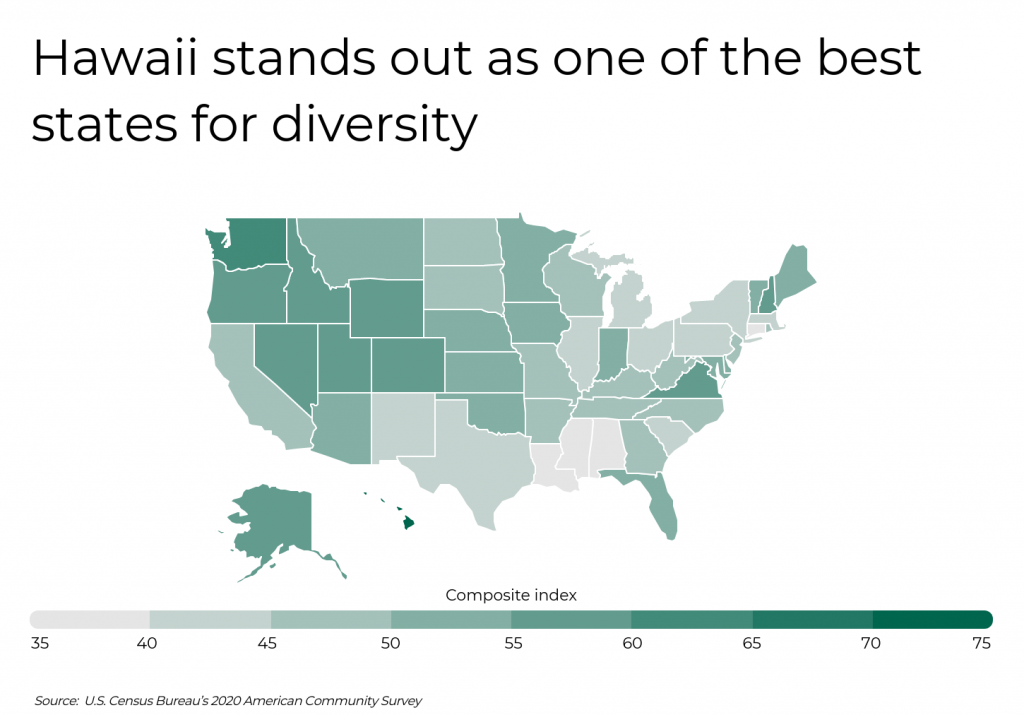
Because of this, locations with very high or very low levels of demographic diversity may offer disparate economic conditions for different groups. For example, Texas and California both rate relatively highly for racial and ethnic diversity, but they have wide economic inequality between racial groups. New England states including Maine, New Hampshire, and Vermont are among the least racially and ethnically diverse but also most economically equal states. Hawaii, on the other hand, stands out for offering high levels of both racial and ethnic diversity and economic equality. This makes Hawaii a top location for those wishing to enjoy the social and cultural benefits of diversity along with widely shared economic well-being.
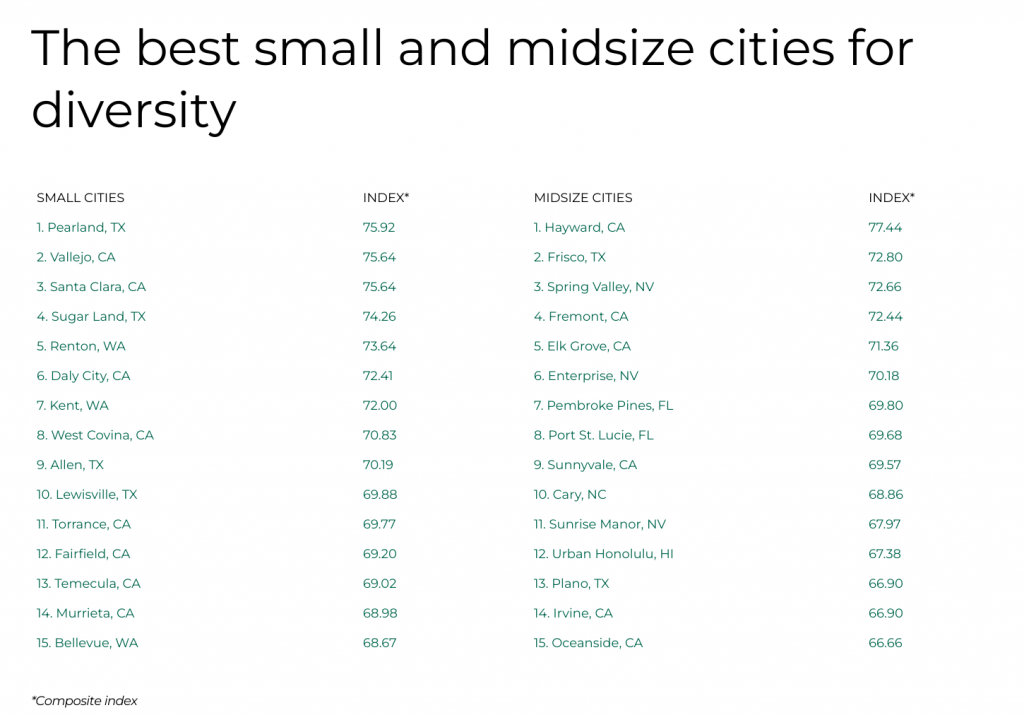
At the metro level, a number of cities offer similar combinations of diversity and equality. According to a composite index that includes racial/ethnic diversity, birthplace diversity, and economic equality, many of the best U.S. cities for diversity are located in the Western U.S. Cities in states like California, Colorado, and Arizona have growing and increasingly diverse populations due to high rates of immigration, and they are simultaneously experiencing economic growth that benefits their diverse residents.
The data used in this analysis is from the U.S. Census Bureau’s 2020 American Community Survey. To determine the best locations to move to for diversity, researchers at Filterbuy calculated a composite index based on equally-weighted indices of ethnic/racial diversity, birthplace diversity, and economic equality. To improve relevance, only cities with at least 100,000 residents were included. Additionally, cities were grouped into cohorts based on population size: small (100,000–149,999), midsize (150,000–349,999), and large (350,000 or more).
Here are the best U.S. cities to move to for diversity.
The Best Large Cities for Diversity

Photo Credit: Sean Pavone / Shutterstock
15. Albuquerque, NM
- Composite index: 53.97
- Ethnic/racial diversity index: 60.80
- Birthplace diversity index: 57.10
- Economic equality index: 44.00

Photo Credit: Sean Pavone / Shutterstock
14. Portland, OR
- Composite index: 54.76
- Ethnic/racial diversity index: 49.40
- Birthplace diversity index: 61.80
- Economic equality index: 53.07
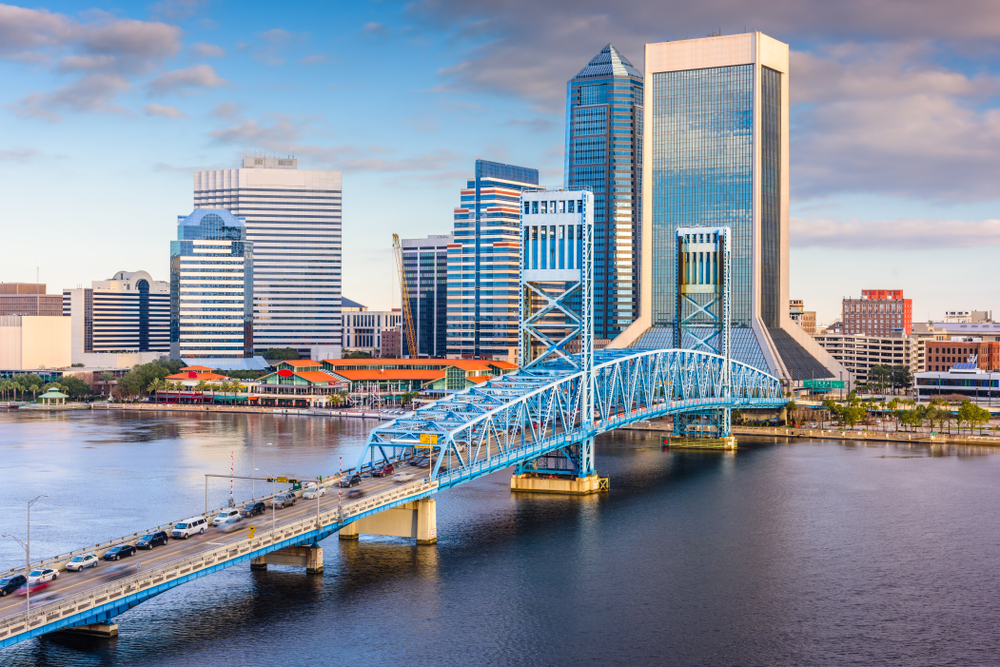
Photo Credit: Sean Pavone / Shutterstock
13. Jacksonville, FL
- Composite index: 55.49
- Ethnic/racial diversity index: 64.20
- Birthplace diversity index: 60.00
- Economic equality index: 42.27
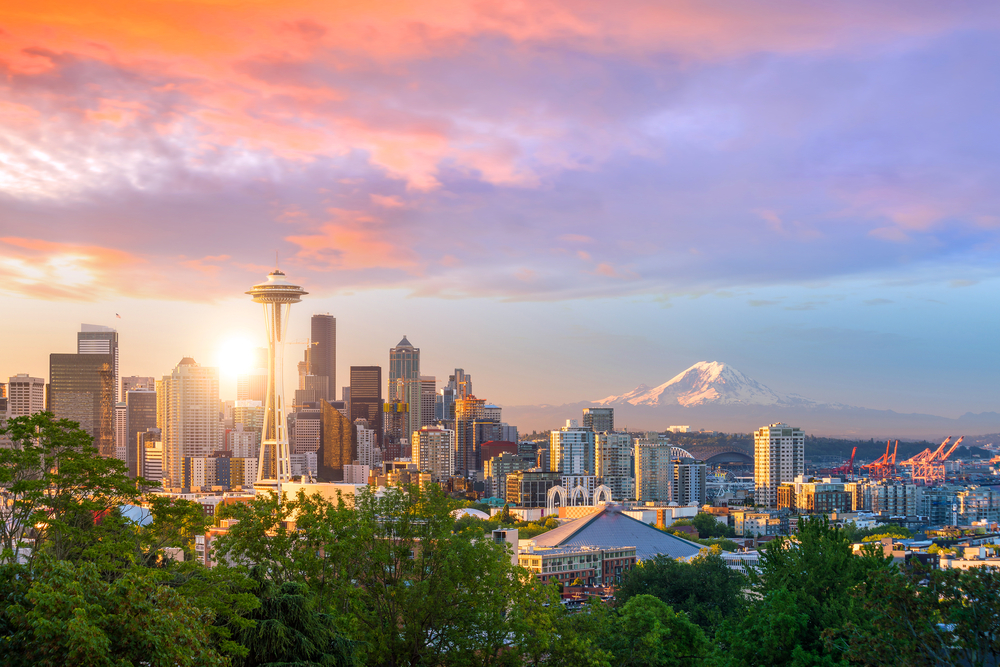
Photo Credit: f11photo / Shutterstock
12. Seattle, WA
- Composite index: 55.68
- Ethnic/racial diversity index: 56.90
- Birthplace diversity index: 66.10
- Economic equality index: 44.03
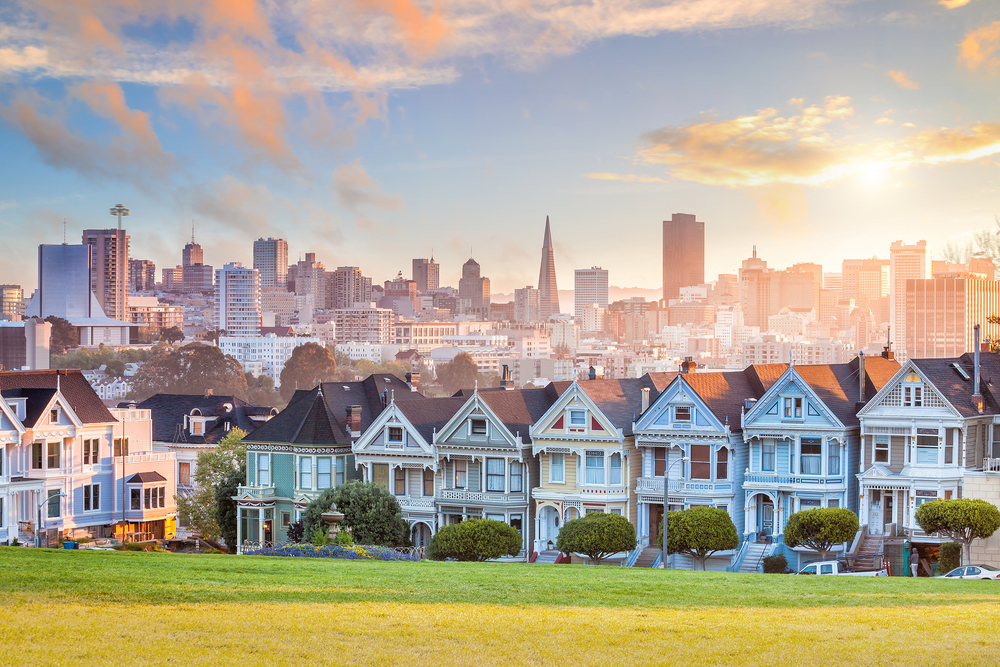
Photo Credit: f11photo / Shutterstock
11. San Francisco, CA
- Composite index: 56.06
- Ethnic/racial diversity index: 69.80
- Birthplace diversity index: 71.90
- Economic equality index: 26.47

Photo Credit: Christopher M Hall / Shutterstock
10. Mesa, AZ
- Composite index: 56.82
- Ethnic/racial diversity index: 54.80
- Birthplace diversity index: 60.40
- Economic equality index: 55.27
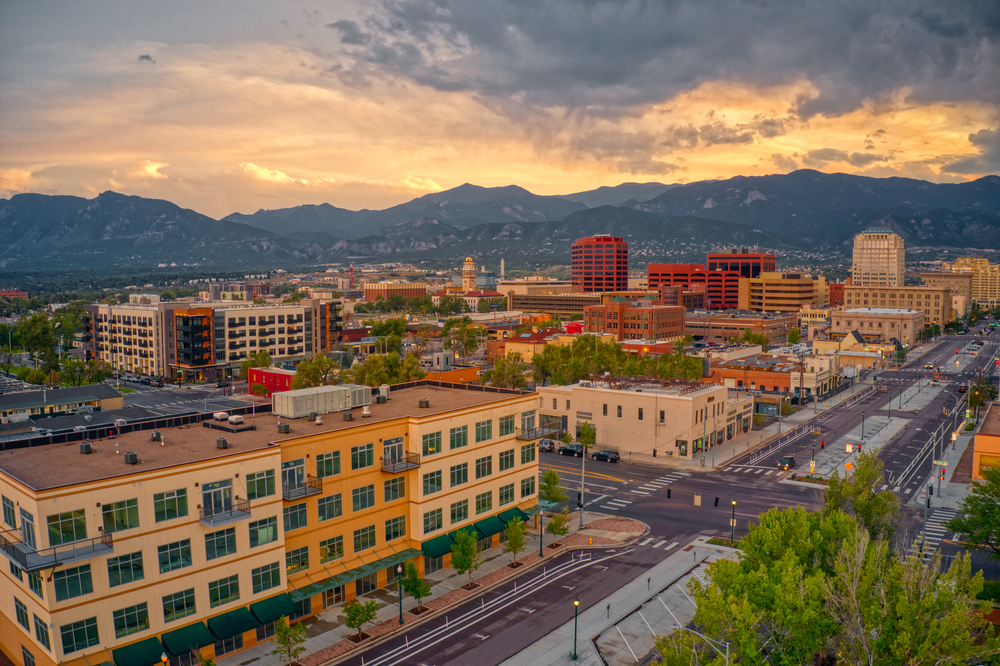
Photo Credit: Jacob Boomsma / Shutterstock
9. Colorado Springs, CO
- Composite index: 57.20
- Ethnic/racial diversity index: 50.00
- Birthplace diversity index: 54.00
- Economic equality index: 67.60

Photo Credit: Peter Witham / Shutterstock
8. Arlington, TX
- Composite index: 59.40
- Ethnic/racial diversity index: 71.20
- Birthplace diversity index: 64.00
- Economic equality index: 43.00
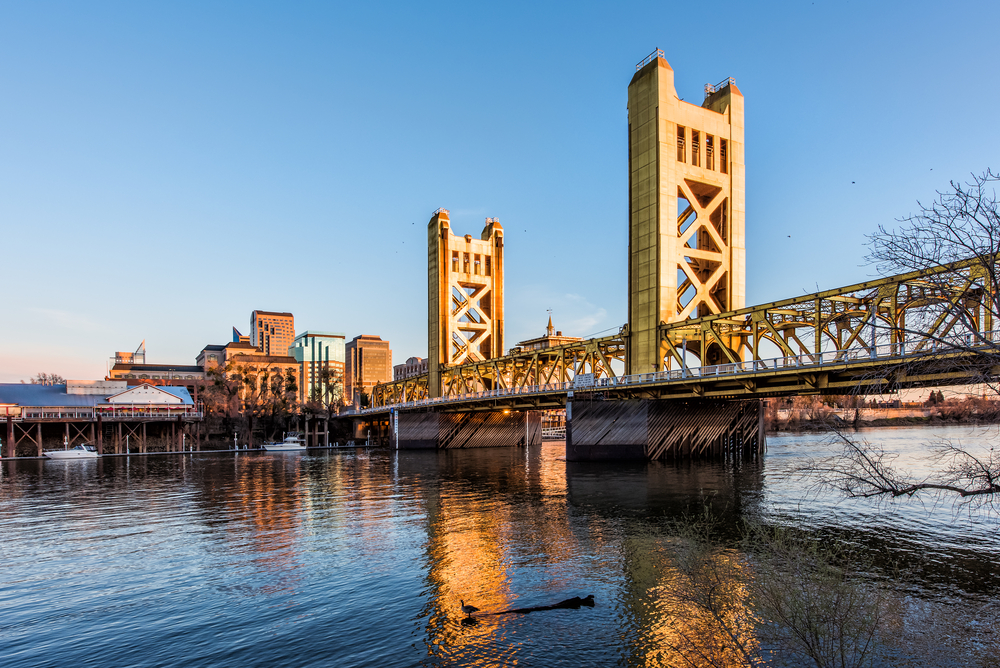
Photo Credit: Andriy Blokhin / Shutterstock
7. Sacramento, CA
- Composite index: 60.01
- Ethnic/racial diversity index: 76.20
- Birthplace diversity index: 57.20
- Economic equality index: 46.63
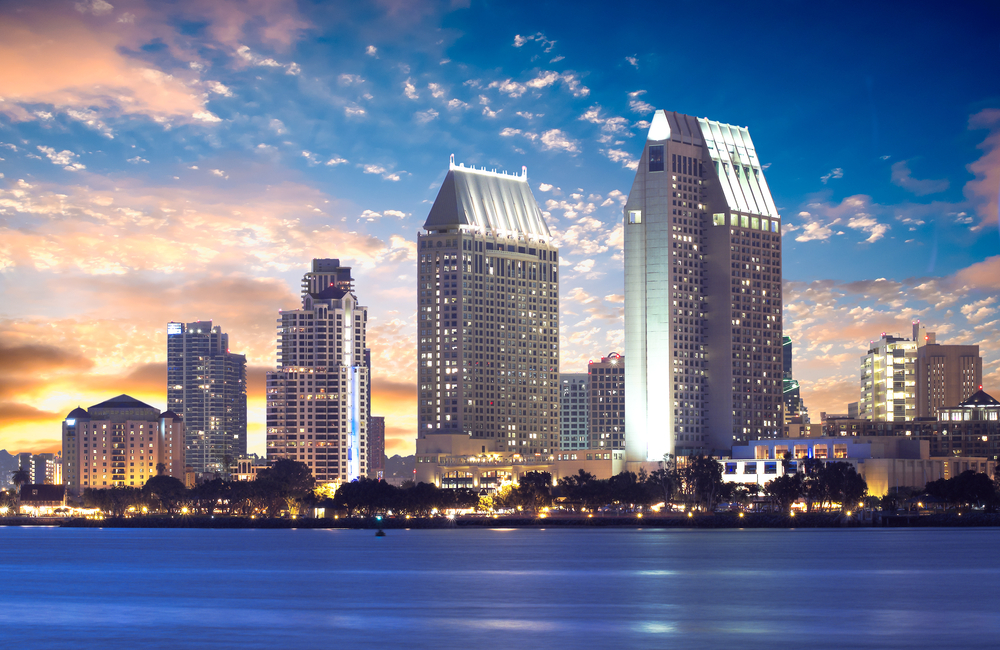
Photo Credit: Dancestrokes / Shutterstock
6. San Diego, CA
- Composite index: 60.09
- Ethnic/racial diversity index: 69.70
- Birthplace diversity index: 67.90
- Economic equality index: 42.67
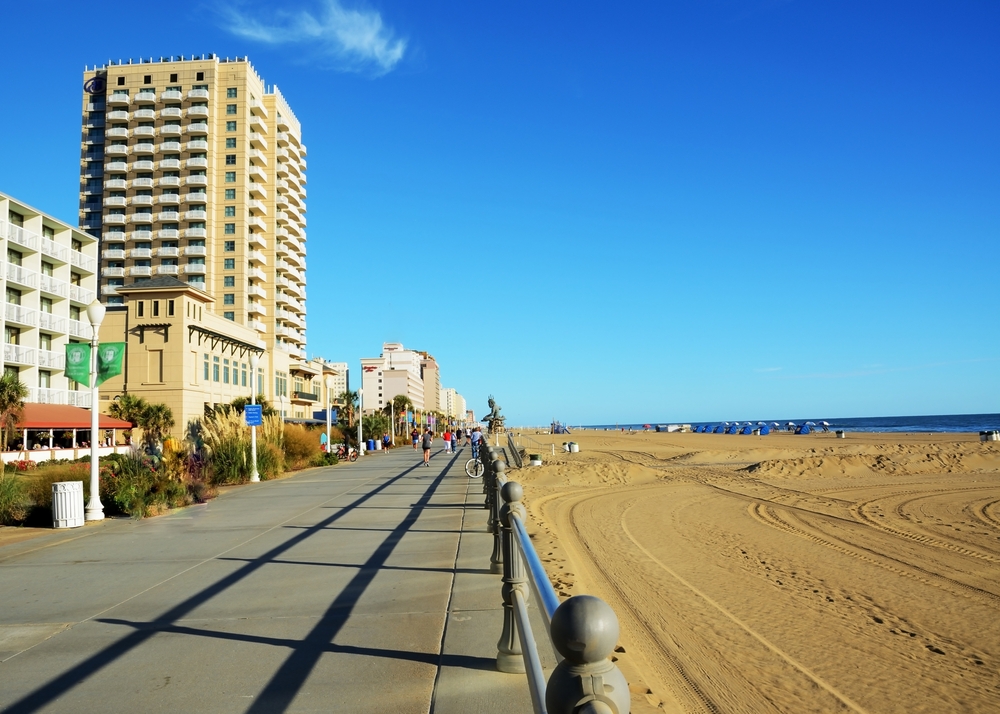
Photo Credit: Alexandr Junek Imaging / Shutterstock
5. Virginia Beach, VA
- Composite index: 60.19
- Ethnic/racial diversity index: 58.00
- Birthplace diversity index: 59.00
- Economic equality index: 63.57

Photo Credit: John Roman Images / Shutterstock
4. Anaheim, CA
- Composite index: 60.93
- Ethnic/racial diversity index: 62.80
- Birthplace diversity index: 63.60
- Economic equality index: 56.40
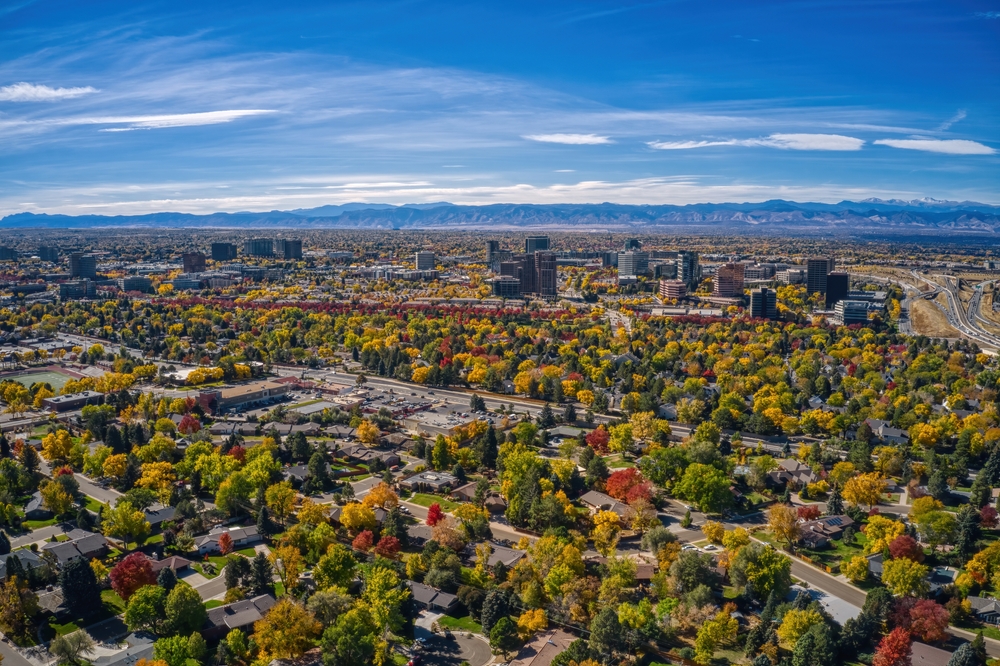
Photo Credit: Jacob Boomsma / Shutterstock
3. Aurora, CO
- Composite index: 61.49
- Ethnic/racial diversity index: 69.20
- Birthplace diversity index: 67.20
- Economic equality index: 48.07
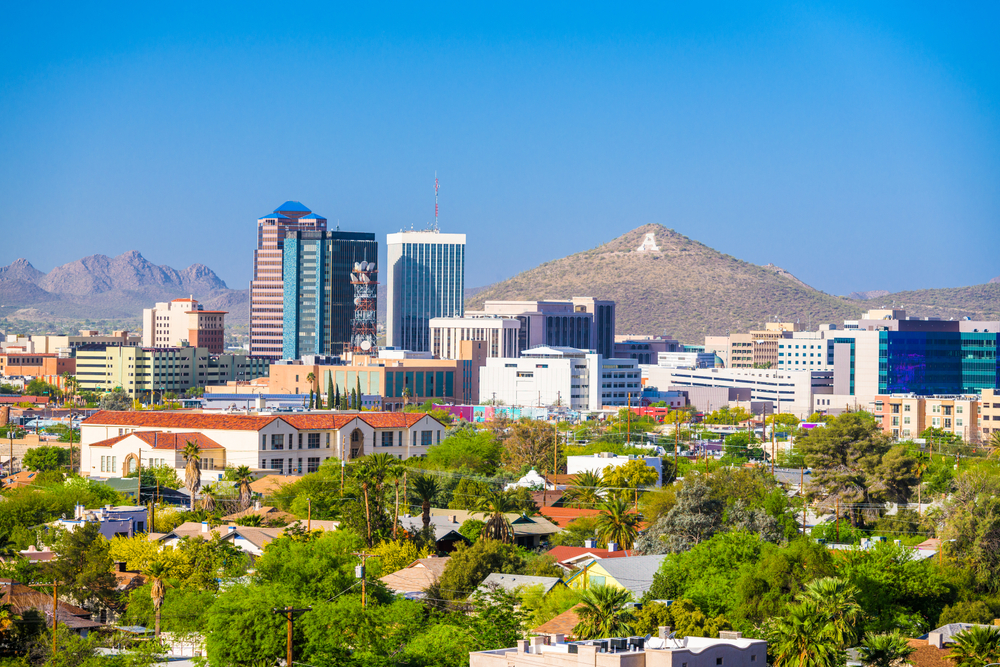
Photo Credit: Sean Pavone / Shutterstock
2. Tucson, AZ
- Composite index: 61.69
- Ethnic/racial diversity index: 61.30
- Birthplace diversity index: 62.50
- Economic equality index: 61.27
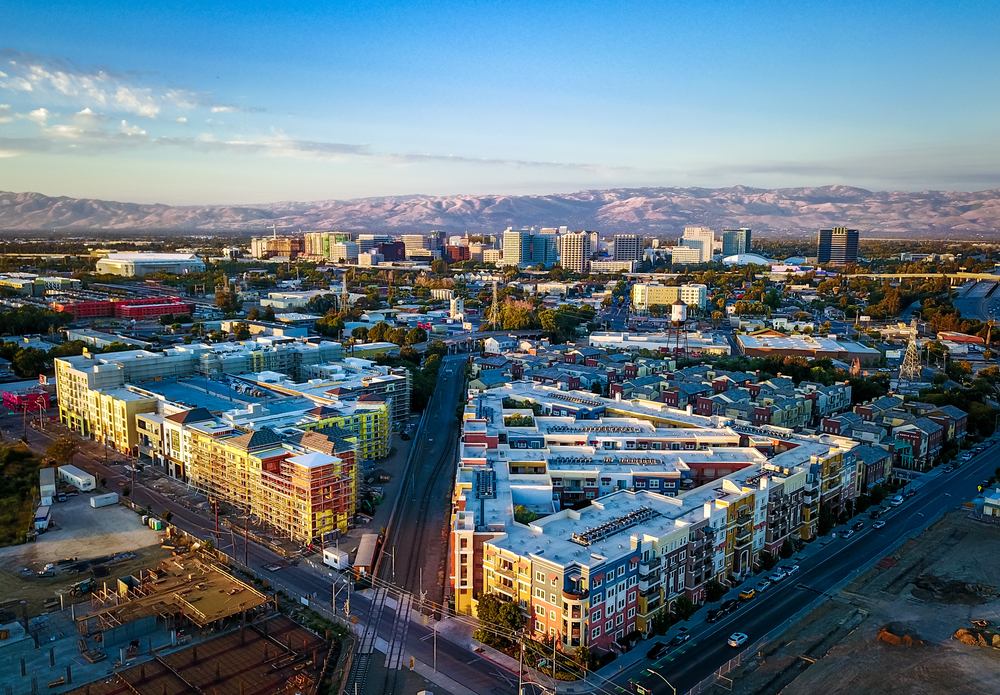
Photo Credit: Uladzik Kryhin / Shutterstock
1. San Jose, CA
- Composite index: 62.92
- Ethnic/racial diversity index: 70.30
- Birthplace diversity index: 67.90
- Economic equality index: 50.57
Detailed Findings & Methodology
The data used in this analysis is from the U.S. Census Bureau’s 2020 American Community Survey. To determine the best locations to move to for diversity, researchers calculated a composite index based on the following (equally-weighted) factors out of 100:
- Ethnic/racial diversity – calculated using a Simpson’s Diversity Index using the following distinct groups:
- Hispanic or Latino
- White alone, non-Hispanic
- Black or African American alone, non-Hispanic
- American Indian and Alaska Native alone, non-Hispanic
- Asian alone, non-Hispanic
- Native Hawaiian and Other Pacific Islander alone, non-Hispanic
- Some Other Race alone, non-Hispanic
- Multiracial, non-Hispanic
- Birthplace diversity – calculated using a Simpson’s Diversity Index using the following distinct groups:
- Born in current state of residence
- Born in another state of the United States
- Born in Europe
- Born in Asia
- Born in Africa
- Born in Oceania
- Born in Latin America
- Born in Northern America (not in the U.S.)
- Economic equality – calculated as a composite index based on the following factors:
- Gini index of economic inequality
- Minority income gap
- Minority poverty gap
To improve relevance, only cities with at least 100,000 residents were included. Additionally, cities were grouped into cohorts based on population size: small (100,000–149,999), midsize (150,000–349,999), and large (350,000 or more).