The annual tax filing season began again in late January, and over the next few months, tax burdens will be top of mind for many Americans as they prepare their 2023 returns.
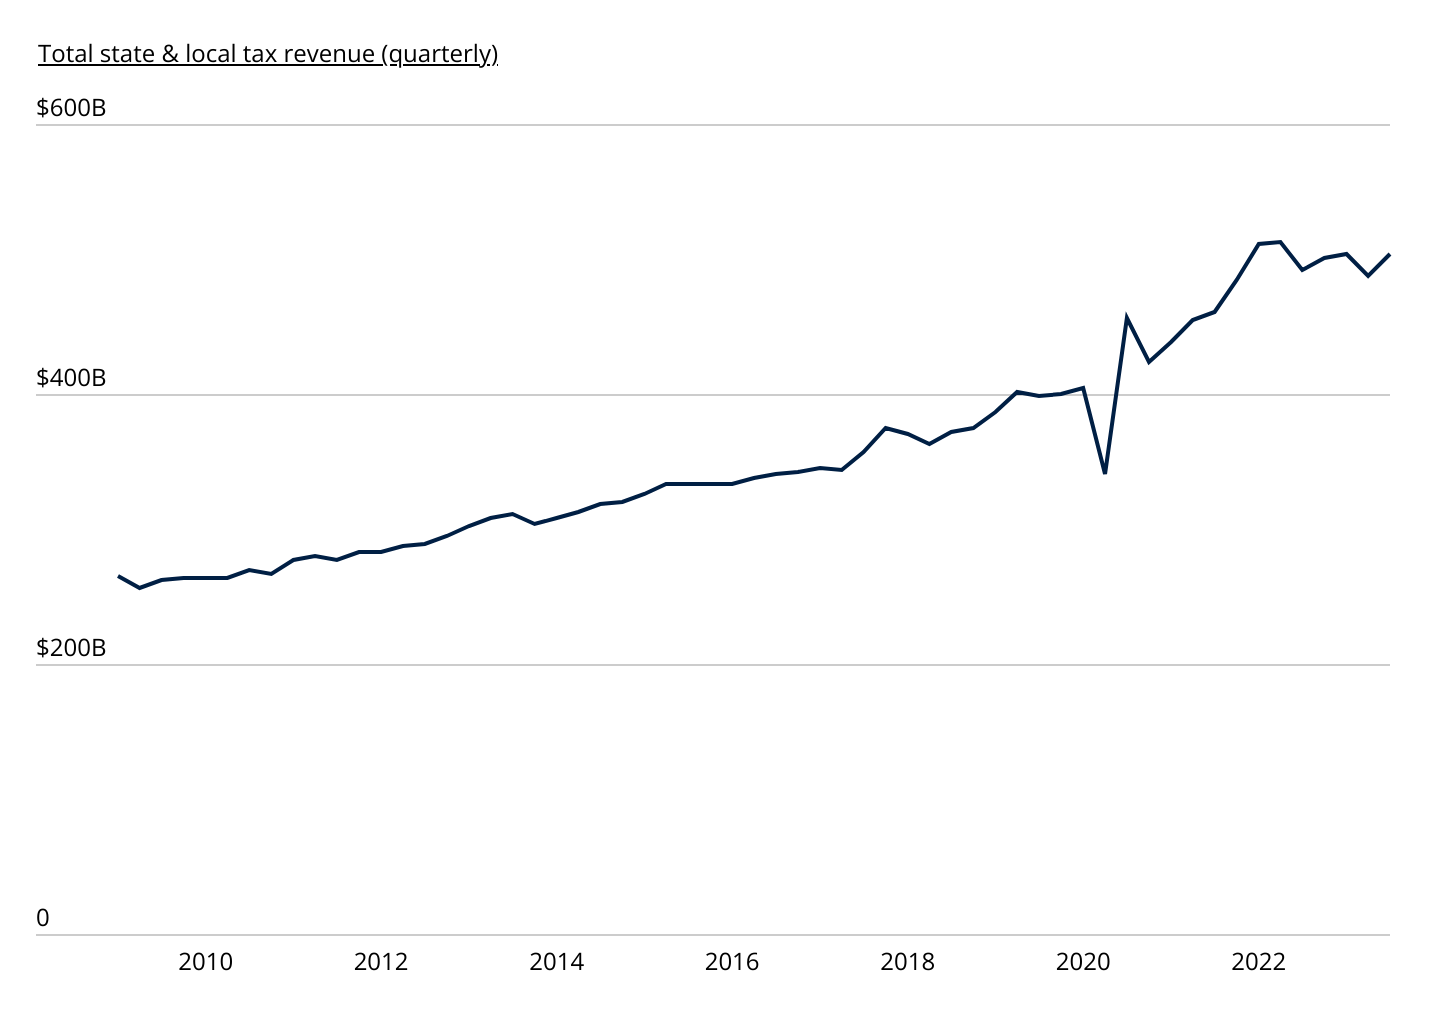
Though filers may dread the annual process, tax collections are critical for all levels of government in determining revenues, setting budgets, and ultimately providing public services. While states and localities more heavily rely on sales taxes, property taxes, or other types of taxation for funding, many also depend on personal income taxes as part of their revenue mix. In the third quarter of 2023 alone, state and local governments collected $119 billion in individual income taxes, which represented 28.8% of total tax revenue.
State & Local Tax Revenue
The total amount of state & local tax revenue collected increased sharply in recent years

Source: Flippa analysis of U.S. Census Bureau data | Image Credit: Flippa
The onset of the COVID-19 pandemic sparked a sharp disruption in state and local tax revenue due to the closure of many parts of the economy. Since mid-2022, however, the economy has remained resilient and produced strong state and local tax collections. Consumer spending on taxable goods has been high even in the face of inflation, increasing residential real estate values have boosted property tax collections, and incomes have risen during a run of low unemployment. These and other factors have led to a nearly 25% increase in state and local tax collections since before the pandemic began in early 2020.
However, many of these same factors—particularly inflation and real estate values—have made the cost of living in high-tax states even more expensive. States like New York, Connecticut, and California have the highest state and local tax burdens for their residents and rank among the most expensive locations for cost of living, leaving less in the way of discretionary income. Higher earners in these locations have been burdened further due to new limits on state and local tax deductions.
These expensive states have also seen flattening or declining populations in recent years as more Americans migrate to cheaper locations in the Sun Belt and Mountain regions. Some observers have noted that these states also tend to have lower tax rates as evidence that lower taxes might be motivating interstate movers. However, others suggest that people move for reasons independent of tax concerns and that, in fact, lower taxes in a location may result in underfunded services that make that location less desirable for movers in the long run.
Regardless of why people are moving and whether tax policy plays a role, the ultimate conclusion is that residents in the U.S. are subject to vastly different tax liabilities depending on where they live. For high earners, these variations can add up to tens of thousands of dollars in savings—or additional costs—on an annual basis.
Geographic Differences in State & Local Taxes
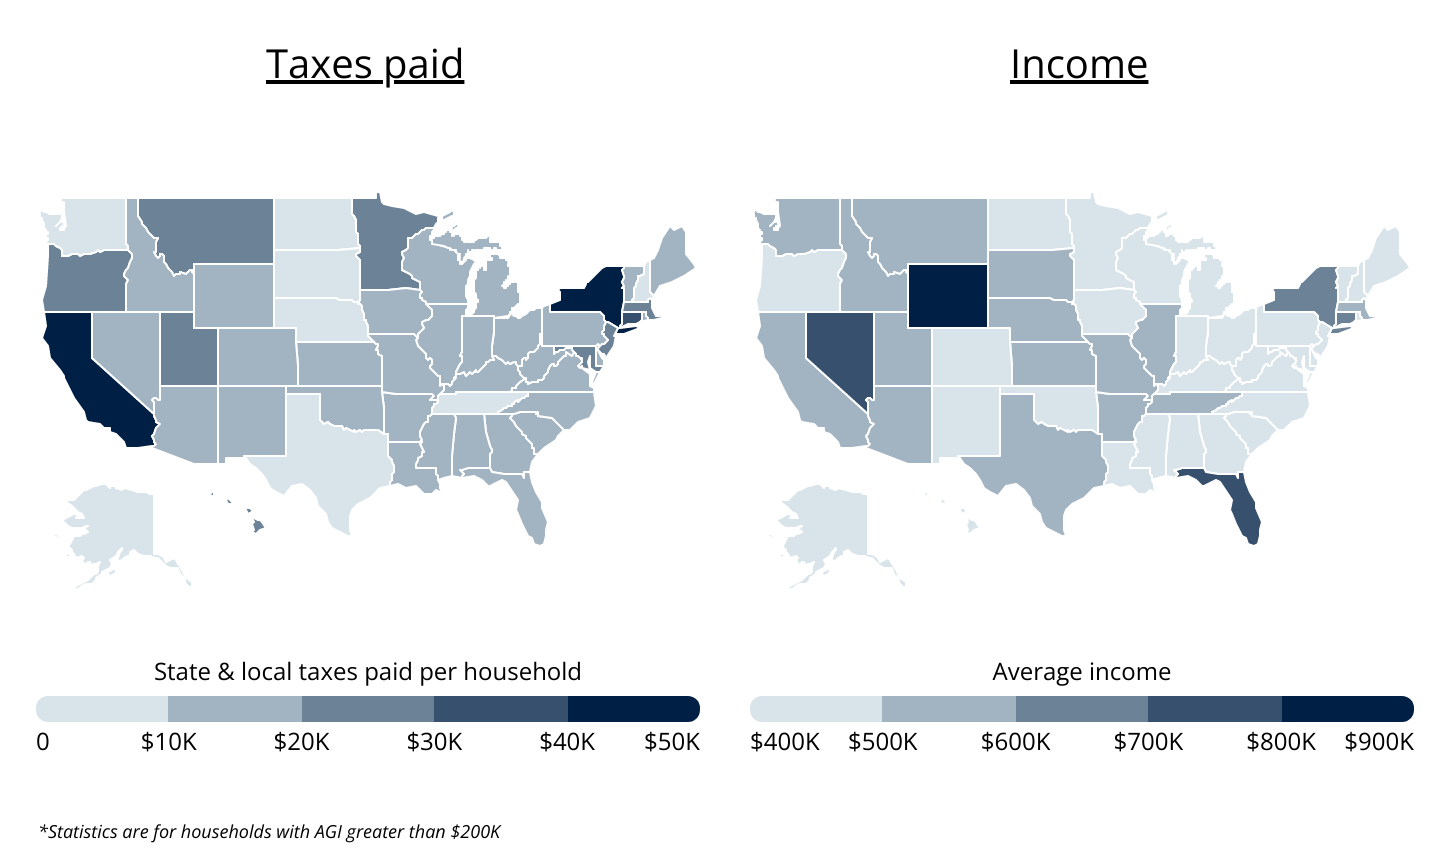
High-income residents in New York & California pay ~5X more in taxes than those in Texas

Source: Flippa analysis of IRS data | Image Credit: Flippa
New York and California stand out as the states with the highest state and local taxes for residents earning more than $200,000 per year. High-income households in both states pay around $45,000 in state and local taxes on average, enough to account for more than 7% of the average income among high earners. The average amount of state and local taxes paid in New York—$45,956—is nearly 15 times that of the lowest state, Alaska, where high earners pay an average of just $3,332. And fortunately for residents of the states with the highest earners on average—Wyoming, Florida, and Nevada—each of those states ranks in the bottom half of total average state and local tax payments.
Unsurprisingly, metros in New York, California, and other coastal states like Connecticut and New Jersey lead the nation in taxes paid for high-income households. Ten of the top 12 metros are found in California alone. High earners pay far less in cities in Florida, Texas, and select other states, likely in part due to those states’ lack of personal income tax.
Below is a complete breakdown of state and local taxes paid by households earning more than $200,000 for nearly 400 U.S. metropolitan areas and all 50 states. The analysis was conducted by Flippa—a marketplace for buying and selling digital businesses—using data from the IRS. For more information, see the methodology section.
Methodology

Photo Credit: Andrey Popov / Shutterstock
The statistics shown are derived from IRS individual income tax data aggregated by the principal residence of filers with $200,000 or more in adjusted gross income for tax year 2020, the most recent year available. As such, the data represents the total amount of state and local taxes paid by residents of each location (regardless of where the tax was actually paid). To determine the locations where high-income residents pay the most in taxes, researchers at Flippa calculated the total amount of state and local taxes paid by high-income filers divided by the total number of high-income filers. These taxes include income, sales, real estate, and personal property taxes.
For complete results, see Cities Where High Earners Pay the Most (and Least) in Taxes on Flippa.


